Apartment Market Pulse Spring 2025
Demand Remains Resilient Amid Economic Uncertainty and Affordability Challenges
Macroeconomic Environment: New White House Administration
The first quarter of 2025 experienced an economy dominated by a new administration in the White House. The Trump administration largely focused on several large-scale initiatives with potential to impact the broader economy, including renegotiating international trade agreements, reducing the size of the federal government workforce and addressing immigration.
The White House has employed tariffs as the main tool to bring trading partners to the negotiating table. While many of the initial levies were either postponed or scaled back following bilateral negotiations, the extent and speed of back-and-forth actions led to a dramatic increase in financial market volatility with potential spillover effects for consumer and business confidence.
The administration's efforts to shrink the federal labor force are delivering similar seesaw effects. While the activities are primarily aimed at scaling back many of the agencies located in metropolitan Washington, D.C., the reduction is taking place across the country—with varying impacts on local communities and their economies.
Economic Impact: Mixed Signals
The rapid-fire actions coming from the White House had a mixed effect on economic indicators. Some figures underscored a stable foundation, while others pointed to uncertain conditions.
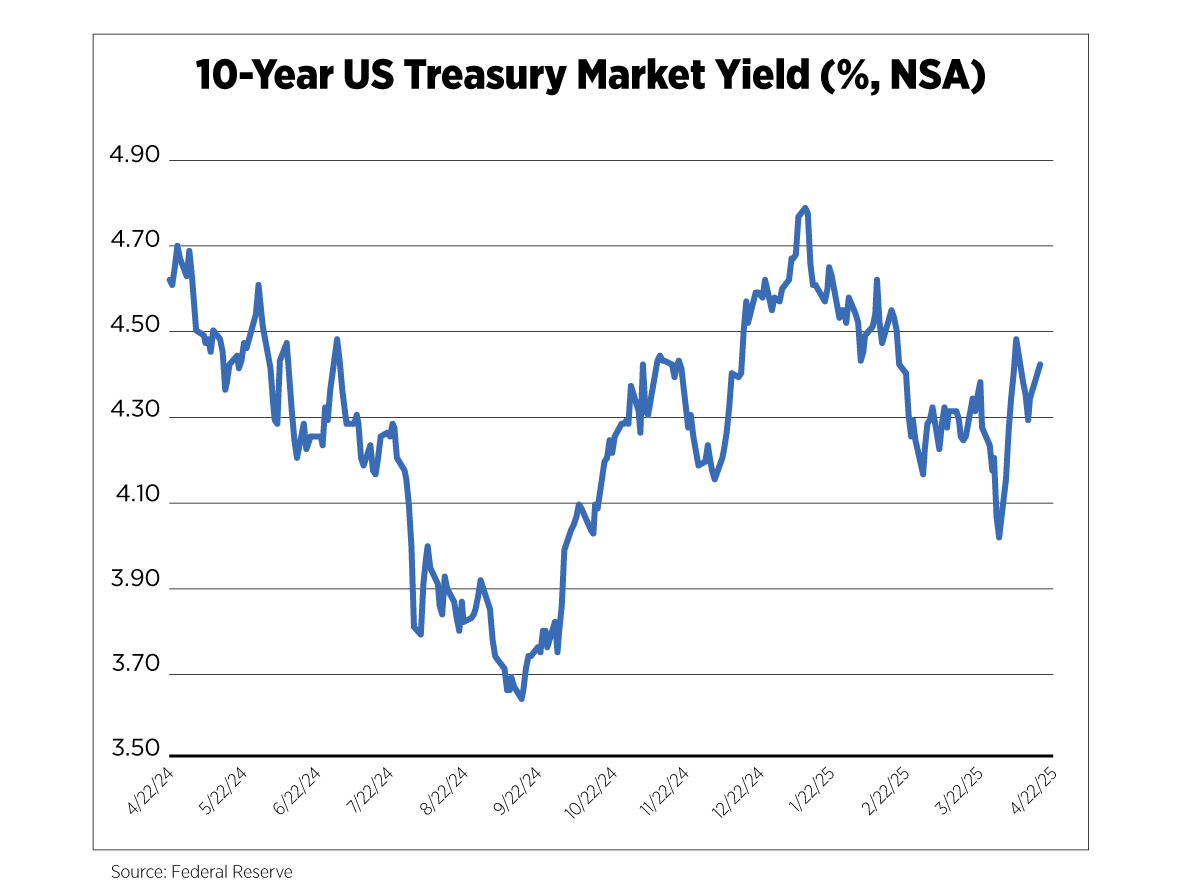
The impact on financial markets has been pronounced, with investors reacting to the whiplash effects reverberating through global money centers. The S&P 500 Index registered a 10.4% drop from January through late April, a slide mirrored by the 8.1% decline in the Dow Jones Industrial Average Index. The 10-year Treasury—traditionally a gauge of mortgage rates and risk-free returns—dropped from 4.62% on January 20 of this year to 3.99% on April 4, only to rebound to 4.40% by April 21. The yield curve—a measure of government debt yield across maturity lengths—remained inverted, signaling increasing investor concern about a potential recession.
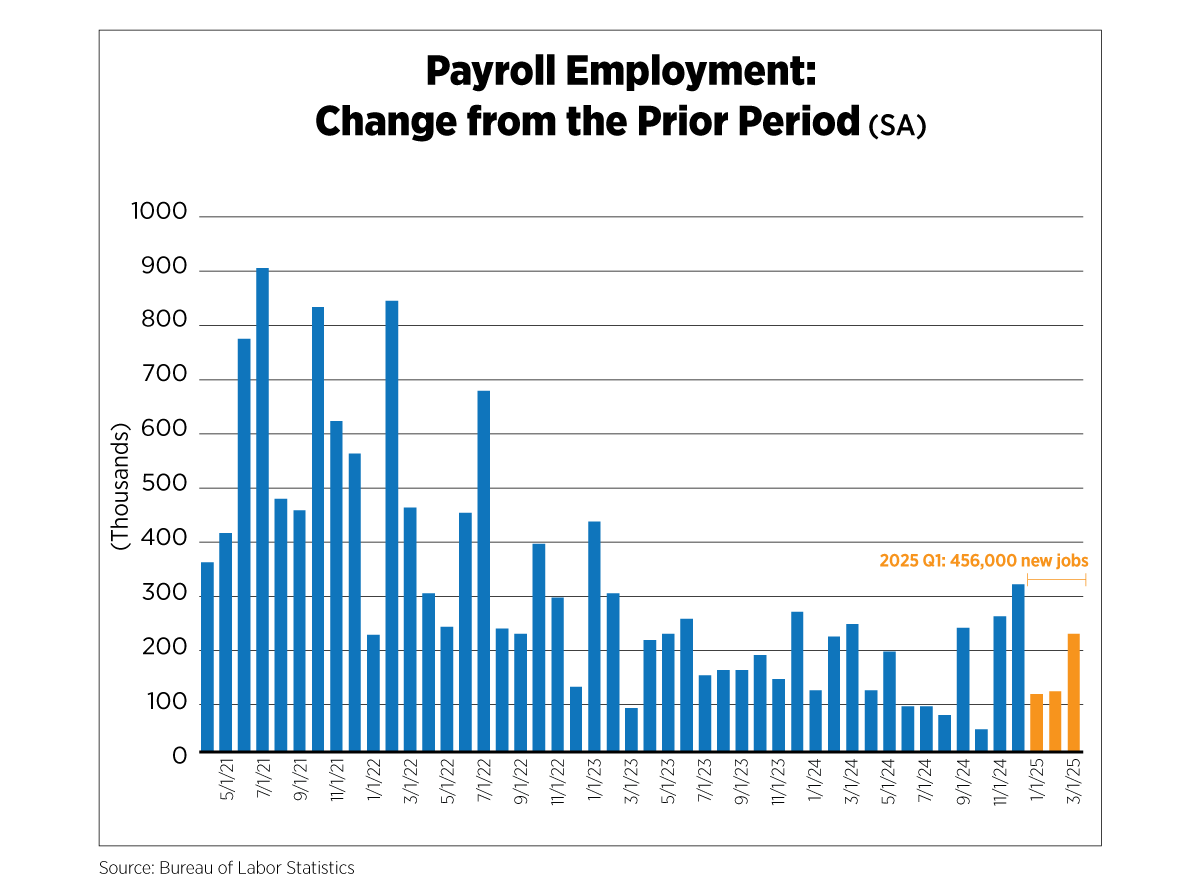
Labor markets remained steady during the first quarter. Payroll employment notched steady growth, with 456,000 new jobs added between January and March. Unemployment insurance claims remained steady, at an average of about 233,000 initial claims per week. And the unemployment rate hovered at 4.2% during the quarter.
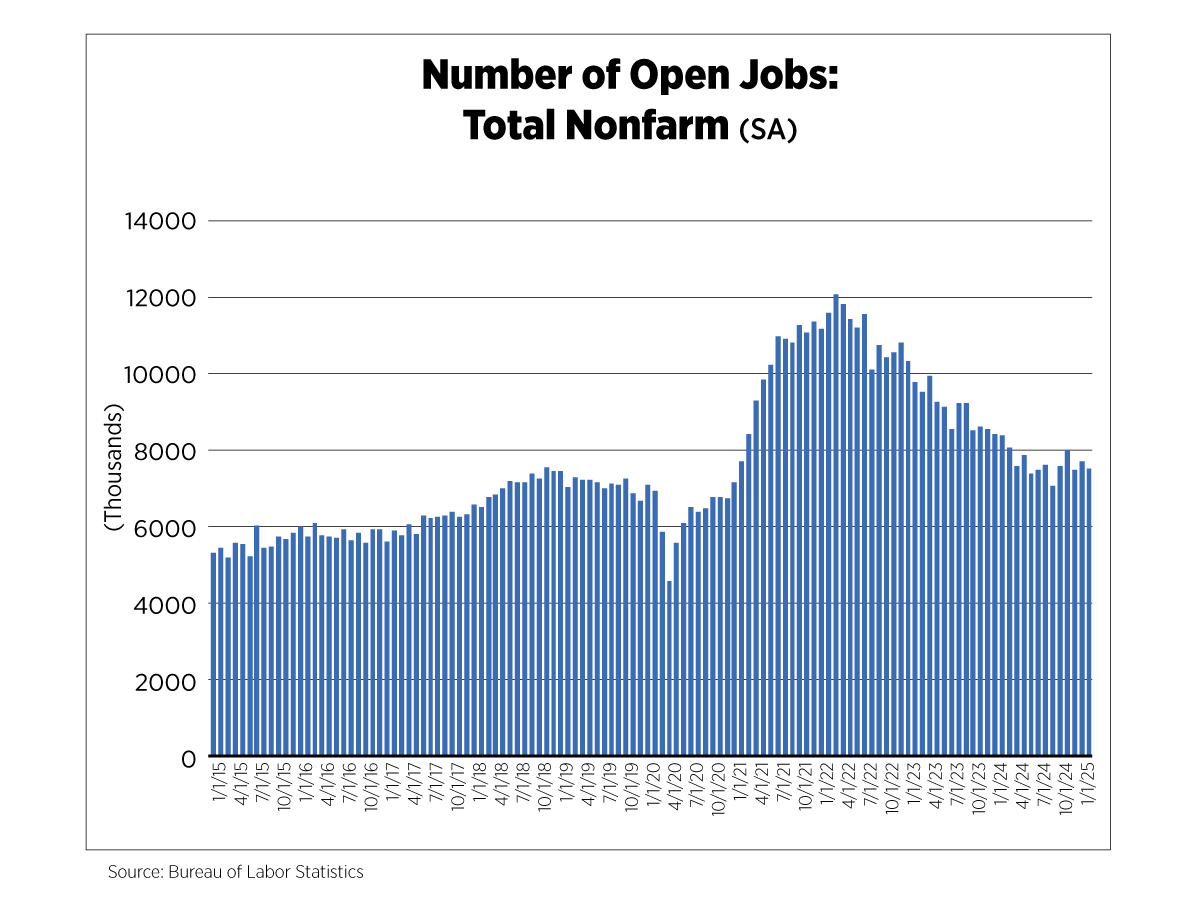
Meanwhile, the number of open jobs—a sign of business confidence and labor demand—remained healthy even as it continued the downward trend that began in April 2022. There were 7.76 million advertised positions in January 2025 and 7.57 million in February. The number of open jobs remains comfortably above the long-run average; however, for many displaced workers, a shrinking pool of options means longer periods without work and higher financial costs.
Notably, with the White House committed to reducing the federal workforce across the country, the impact from those job losses may take a few months to show in the data. It is also worth noting that in many communities, federal employees support an ecosystem of service sector jobs, which may be lost as federal jobs disappear, leading to further retrenchment in employment numbers.
Inflation: Pressures Persist
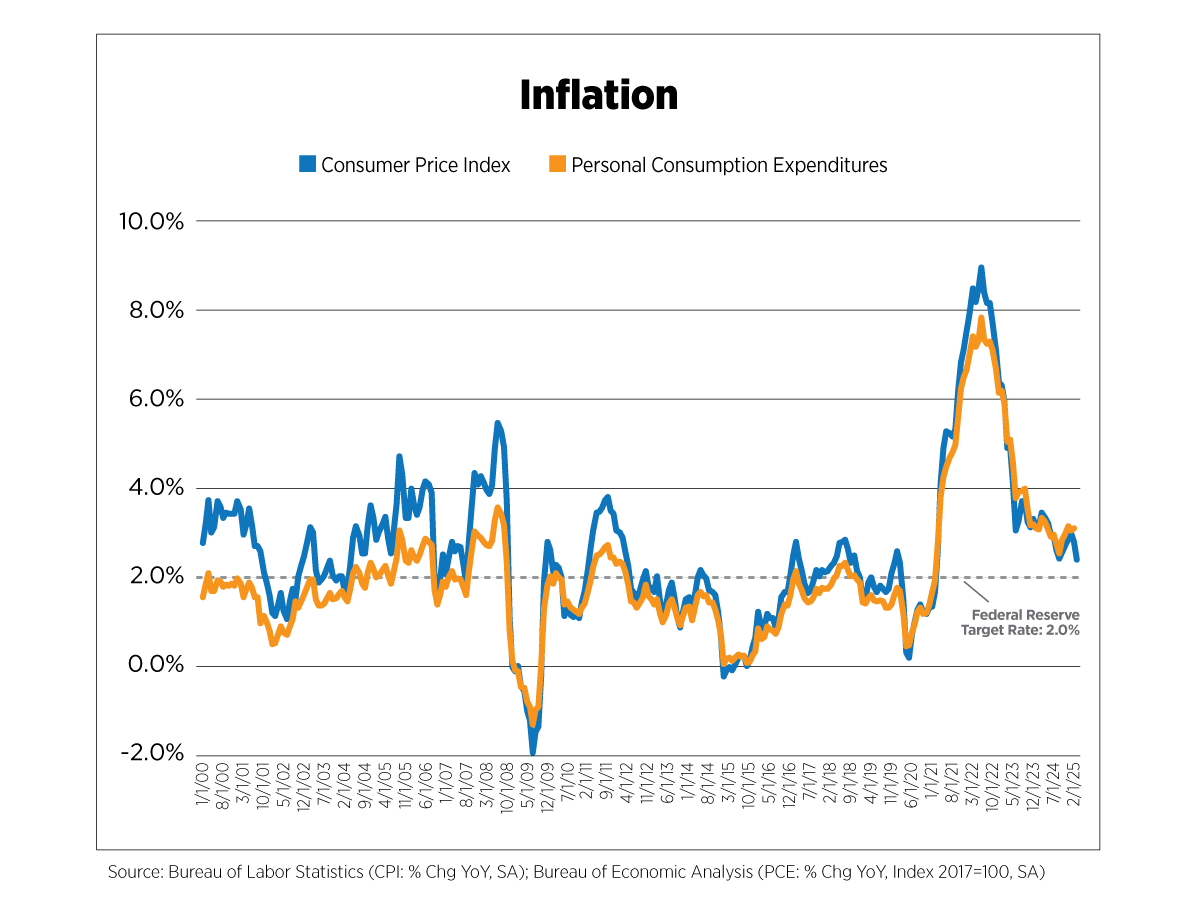
While inflation has been on a slowing path, price pressures continue to weigh heavily on American consumers. Both measures of price growth—the Consumer Price Index and the Personal Consumption Expenditures Index—are still above the Federal Reserve’s target of 2.0%. Moreover, the imposition of tariffs has a direct link to higher prices, as importers of goods such as t-shirts, electronics, cars, cheese and coffee pass higher costs onto consumers. Economists may rejoice at a 2.4% annual increase in the CPI in 2025, compared with the 8.5% from 2022. But for a family still wrestling with rising prices for eggs, socks, heating and medical care, the idea of slowing inflation remains remote.
The silver lining is that buoyed by a stable job market, consumers continued to spend in the first quarter. Retail sales rose 4.1% during Q1 2025 compared with the same timeframe in 2024. Notably, the boost in spending seemed driven by preemptive purchases meant to blunt anticipated tariff-induced price hikes. Consumers were more likely to speed up buying motor vehicles and building materials. However, the spike is likely to be temporary, with forecasts expecting a slowdown in consumer spending growth toward midyear. The longer the uncertainty of federal tariff policy lingers, the higher the likelihood that consumer demand may soften.
Consumer Confidence: Inflation Takes a Toll
Consumer confidence saw a notable decline in March 2025, reaching the lowest point in 12 years, according to the Conference Board's Consumer Confidence Index. The index fell 7.2 points to 92.9, influenced by concerns over tariffs, inflation and economic uncertainty. Importantly, the two main components of the index showed worrying signs. The Present Situation Index—measuring consumers’ view of current business and employment conditions—slid 3.6 points to 134.5. The Expectations Index—assessing Americans’ expected short-term outlook for income, business and job conditions—fell 9.6 points to 65.2, also the lowest level in 12 years. These numbers are well below 80, the marker that the Conference Board considers to be a threshold of recession ahead.
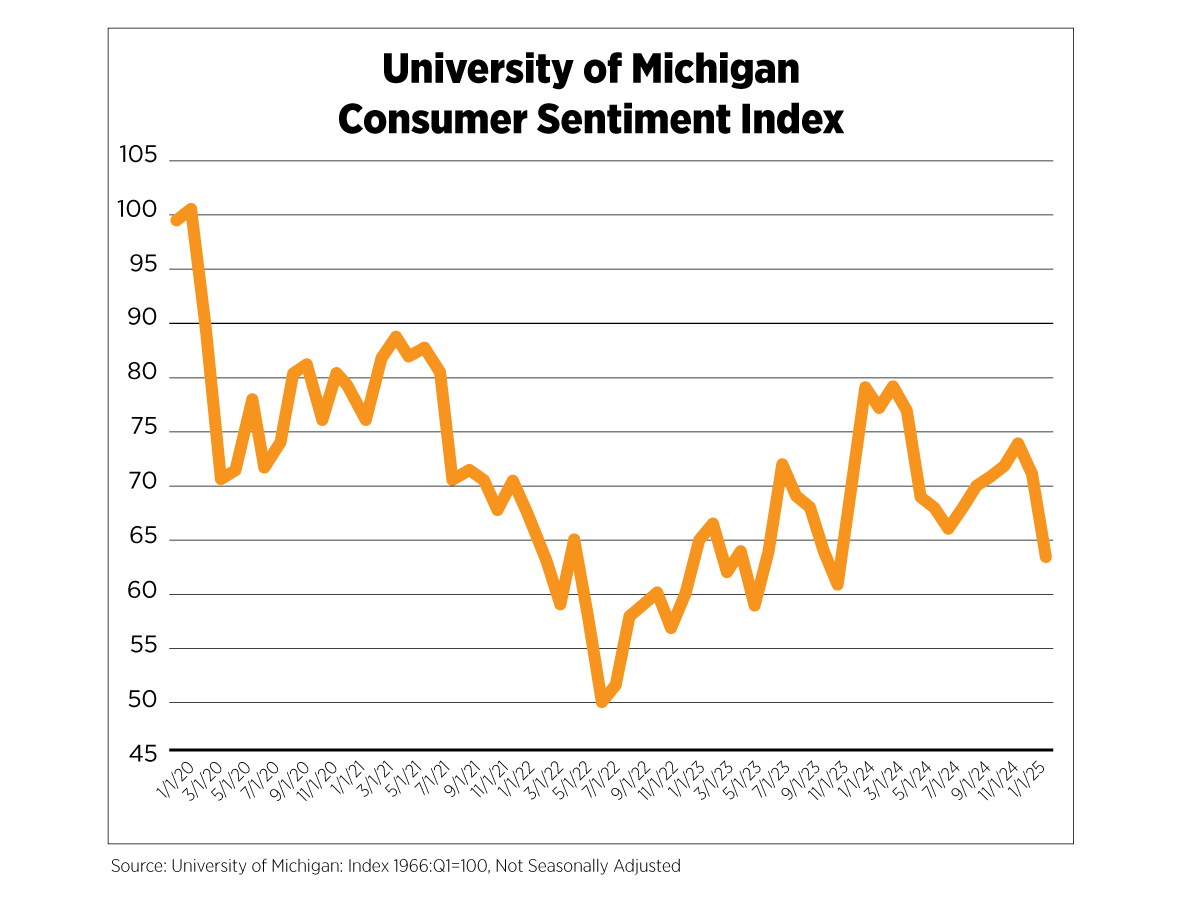
The trend was also mirrored in the University of Michigan’s Consumer Sentiment Index, which posted a 34.2% drop in April 2025 from a year ago. The decline was driven by worsening consumer perceptions of both current conditions and expectations of changes during the next few months.
Federal Reserve Policy: Maintain Steady Course
The Federal Reserve remained focused on the trajectory of price growth and labor markets, maintaining a cautious approach to monetary policy. With the CPI and PCE still higher than the central bank’s target, the rate-setting Federal Open Market Committee kept the overnight interest rate at 5.25% throughout the first quarter of 2025.
In addition, the Fed maintained a substantial $6.7 trillion balance sheet, mostly holdings of Treasury and mortgage-backed securities. However, in a sign of ongoing monetary tightening, the bank continued shrinking its balance sheet as Treasuries and MBS assets matured.
Economic Outlook: Gathering Clouds for Stormy Summer
Looking at the year ahead, the U.S. economy faces several challenges that have the potential to impact real estate markets. The persistent inflation, coupled with overhanging trade tensions and resultant shifts in consumer behavior, will exert pressure on economic growth. If consumers continue to bear the burden of higher prices and job losses, they could pull back on spending, leading to a sustained drop in economic output.
On the last day of April, the Bureau of Economic Analysis released the advanced estimate of gross domestic product for the first quarter of this year. Real GDP declined at an annual rate of 0.3 percent in the first three months. The decline in economic output was driven by a rise in imports, which is calculated as a subtraction from GDP numbers, and a pullback in government spending. Businesses placed orders for goods in anticipation of looming tariffs. Consumer spending remained positive but slowed from the prior quarter. Business investments were positive, offering a counterbalance to slowing economic activity.
While a quarter’s decline in GDP does not mean the economy is in a recession, it is a signal that the ongoing uncertainty is taking a toll. As we move through the second quarter of the year, it will be important to keep an eye on employment and consumer confidence figures.
In addition, the Federal Reserve's policy decisions will be a crucial factor in navigating these challenges. The balancing act for the central bank will be to continue its work in controlling inflation while managing pressures to resort to a premature rate cut which could lead to a rebound in price growth reminiscent of the late 1970s and early 1980s, when stagflation presented a significant threat and required hard-to-swallow action.
U.S. Apartment Market
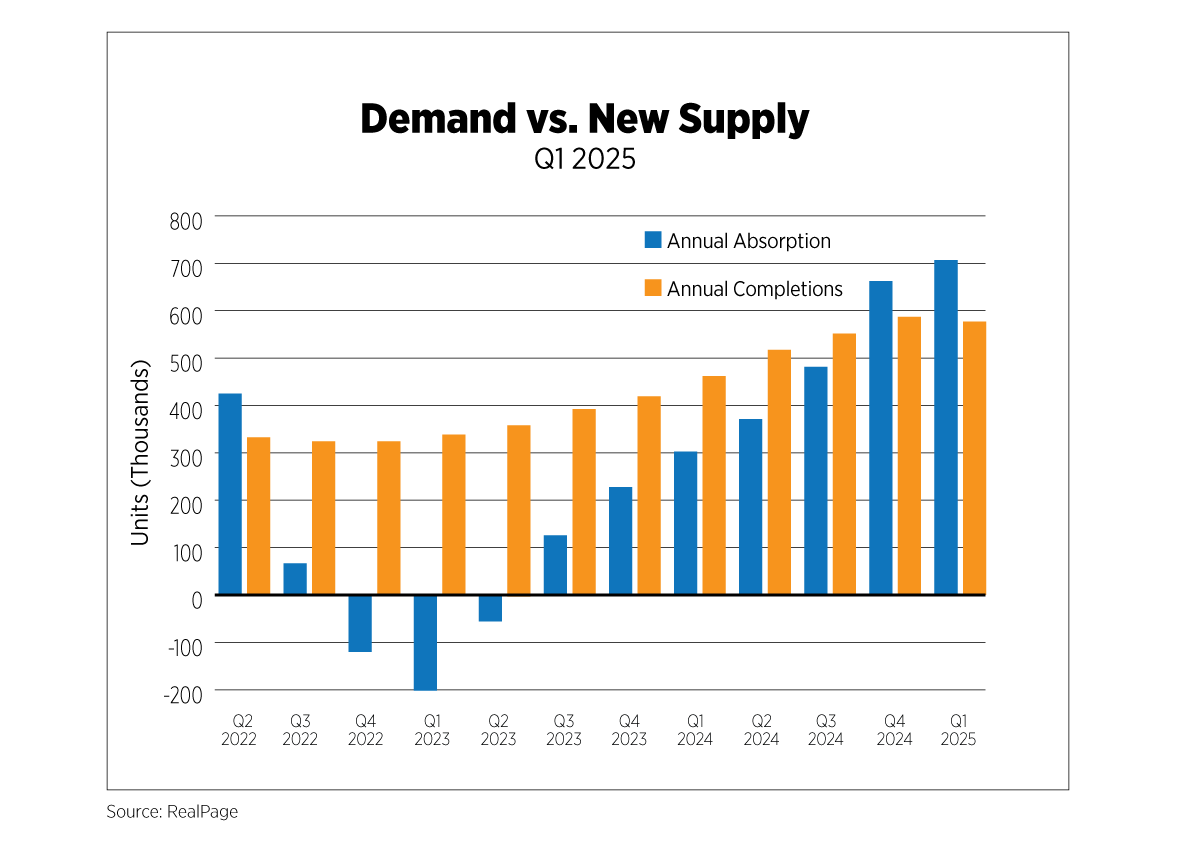
The first quarter of 2025 sustained the momentum initiated in late 2024, with multifamily demand significantly outpacing new supply. Annual absorption reached over 700,000 units – an 18.5% surplus over completions – reflecting a sharp recovery and marking the highest absorption volume since Q1 2022. Year-over-year, this represents a net gain of over 400,000 units, with demand more than doubling from Q1 2024, according to RealPage data.
Conversely, while annual supply expanded by 23.6%, surpassing 570,000 completed units in Q1 2025, quarterly growth declined modestly by 1.4%. This contrast between surging demand and decelerating supply led to a steep negative shift in the supply-demand gap, with absorption approaching twice the volume of new completions. If this trajectory persists, it could lead to modest rent increases and signal a looming supply crisis, especially if new construction fails to ramp up in response. Compounding this pressure, construction inputs, especially for imported building components, are expected to become more expensive as effective tariff rates peak in Q2 2025. Higher material and labor costs may constrain future development activity, further intensifying delivery delays and increasing the risk of an extended supply gap.
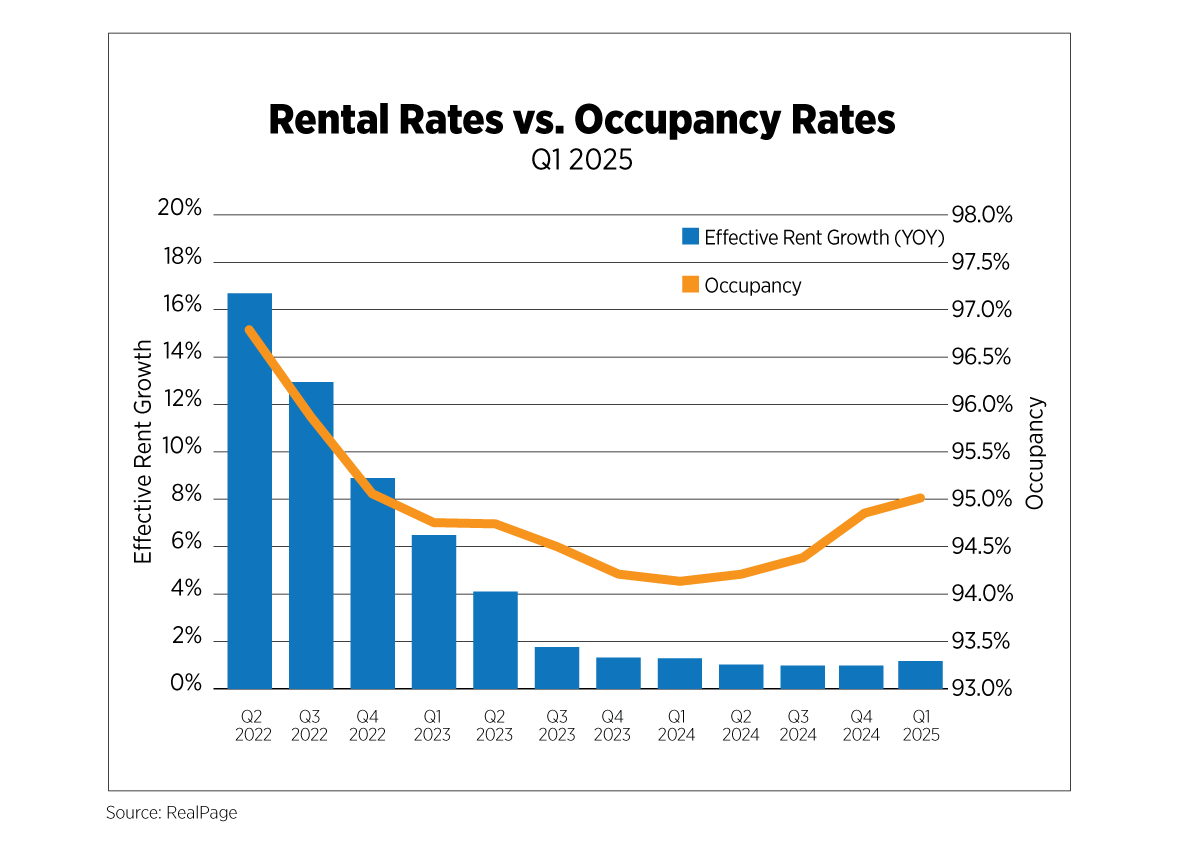
National effective rent reached $1,827 in Q1 2025, indicating a 1.1% annual rise. Though modest, this increase reflects a reversal from the cooling trend of 2023. Rent growth rose slightly by 0.2% from the prior quarter, while occupancy rates also moved upward slightly to 95.0%. As demand grows, occupancy is likely to climb in subsequent quarters, reinforcing tightening rental environment and increasing competition among renters.
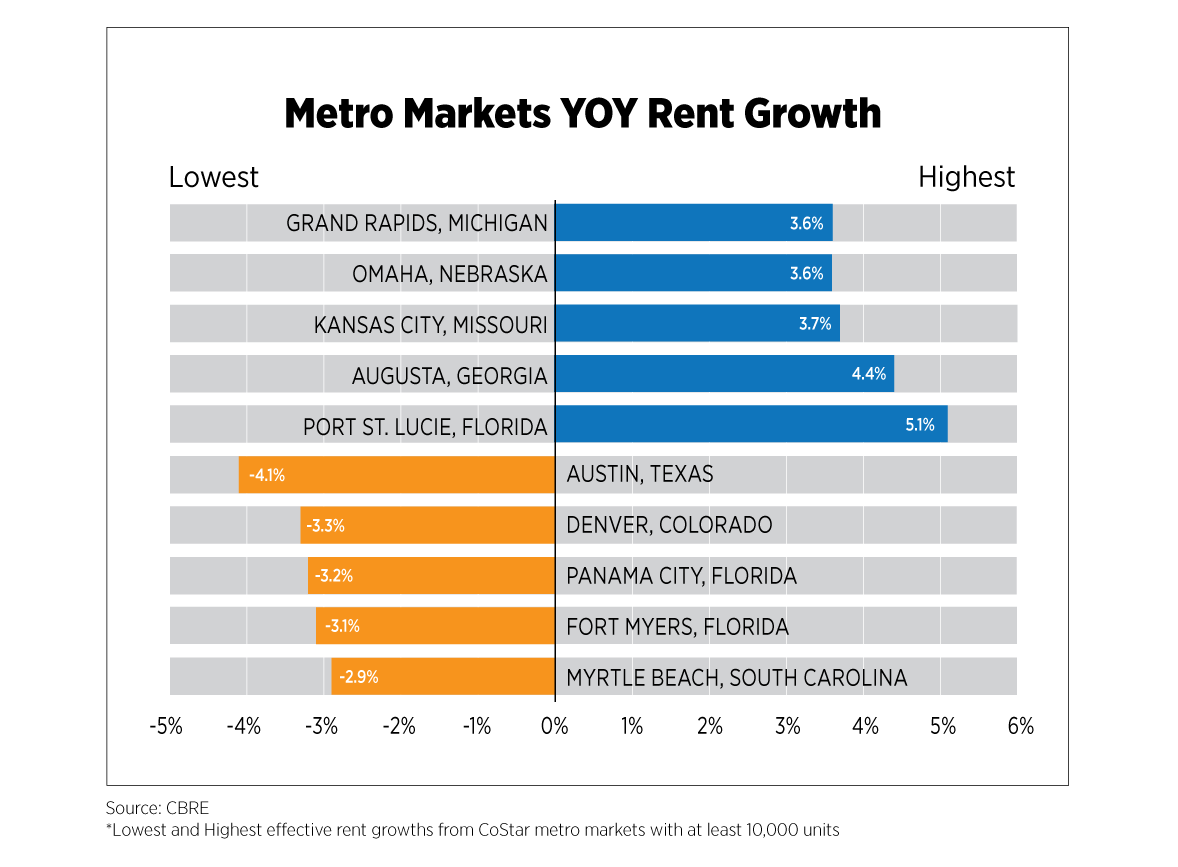
Out of some 89 metropolitan areas tracked by CoStar – with the sample filtered to include only those with at least 10,000 existing apartment units – several markets experienced positive year-over-year effective rent growth, while 31.5% of the markets analyzed had annual declines. Port St. Lucie, Fla., and Augusta, Ga., recorded the highest annual rent growth rates at 5.1% and 4.4%, respectively. Conversely, significant declines in effective rent growth were observed in Austin, Texas (-4.1%); Denver (-3.3%); and Panama City, Fla. (-3.2%). In these markets, rent declines appear to stem from a supply-demand imbalance, where new deliveries outpaced leasing activity.
U.S. Capital Markets
The quarterly multifamily sales volume reached about $22 billion in Q1 2025, reflecting a 38% quarter-over-quarter decline and a 30% year-over-year rise. According to CoStar, sales volume experienced a 38% quarter-over-quarter decline – a noticeable cooldown from the upward trajectory seen toward the end of 2024. However, despite the quarterly contraction, the market still had a 30% year-over-year increase, indicating long-term investor interest amid short-term market headwinds. The slowdown in transaction sales volume trend aligns with the rise in the average price per unit, which rose from about $193,668 in Q1 2024 to $206,705 in Q1 2025, marking a clear upward trajectory in value and reflecting an annual rise of 6.7%, although a quarter-over-quarter drop of 5.4%.
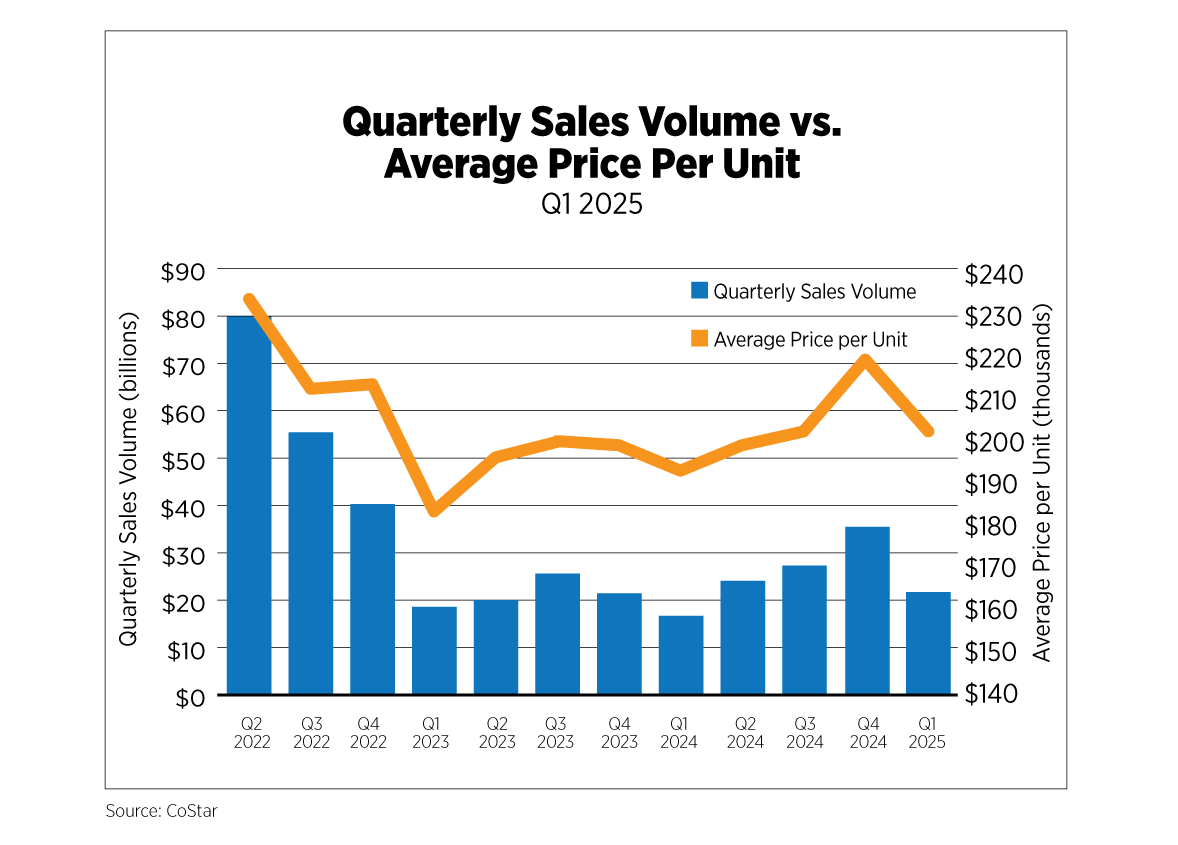
Among the CoStar markets with at least 20 recorded transactions, premium per-unit sales remained concentrated in high-barrier, coastal metros. The highest transaction sales price per unit were in markets such as San Francisco; San Diego; Orange County, Calif.; Washington, D.C.; and East Bay, Calif., with unit prices ranging from $320,000 to about $460,000. On the other hand, the top markets with the highest quarterly sales volume were New York, Los Angeles, Atlanta, Chicago and Boston, with sales activity ranging from $925 million to $2 billion.
U.S. Build-to-Rent Market
The build-to-rent (BTR) sector exhibited mixed performance in Q1 2025, navigating both demand-side softening and cost-side pressures. National effective rent growth in BTR communities grew modestly by 0.4% year-over-year, reaching $2,178, but dipped slightly by 0.1% from the prior quarter, according to Yardi’s single-family BTR national trend report. Meanwhile, occupancy declined to 91.8%, falling 0.8 percentage points year-over-year, pointing to rising vacancy pressures in certain submarkets. Markets such as urban Atlanta (63.1%), Huntsville, Ala. (71.9%) and suburban Maryland (75.9%) reported notably low occupancy. However, several metros such as Northern Virginia (99%), Milwaukee (99.4%) and urban Boston (100%) experienced the highest occupancy levels, highlighting localized demand resilience.
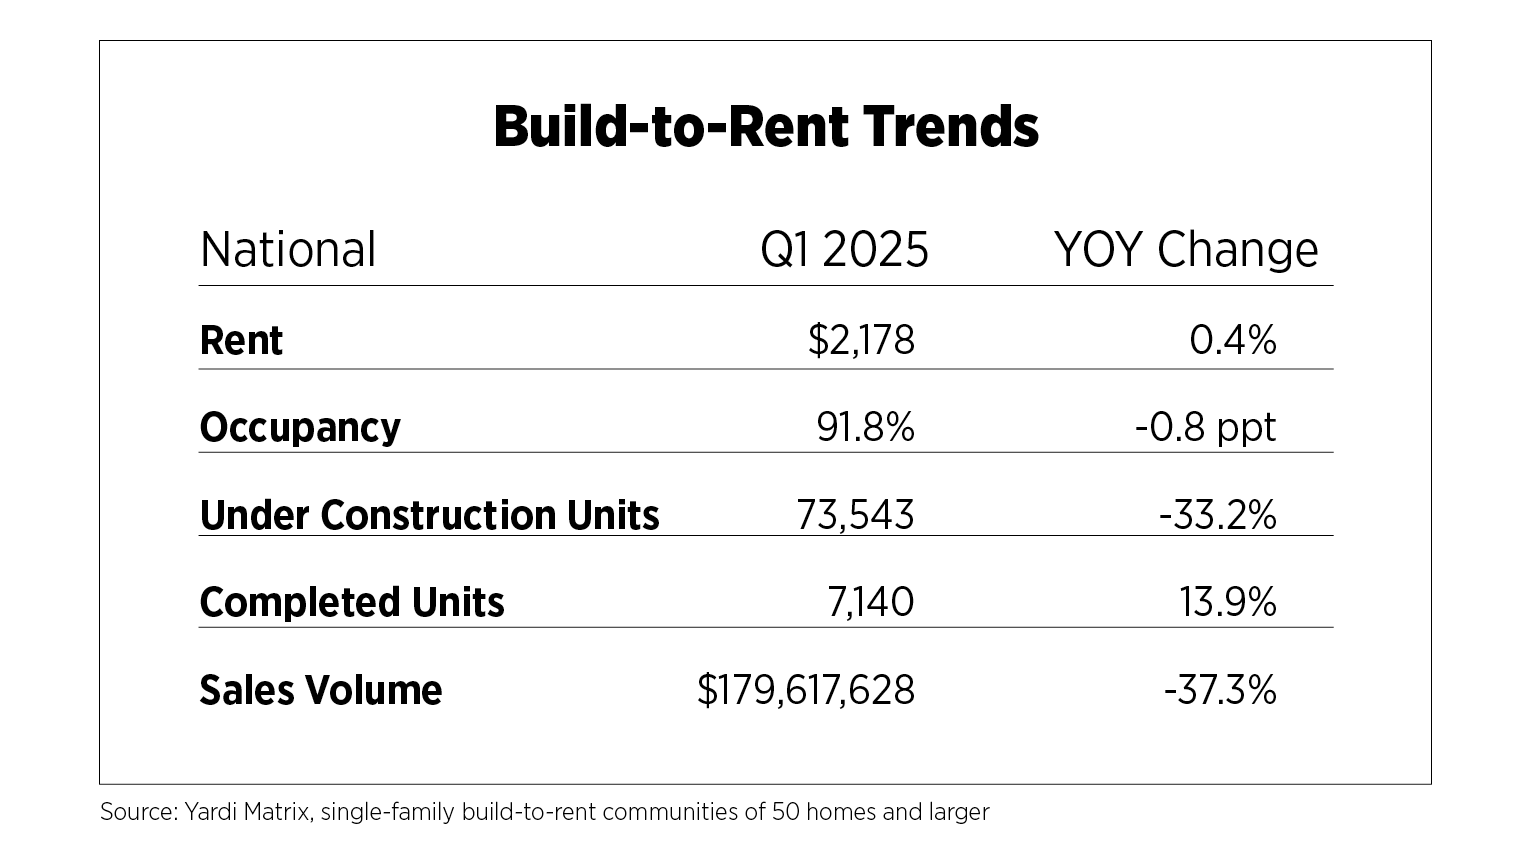
Perhaps the most significant signal of market caution was the drastic decline in BTR sales volume—plunging 37.3% year-over-year from over $280 million to $180 million, and an even steeper 78.1% quarter-over-quarter drop from over $820 million in Q4 2024. This contraction reflects growing investor hesitancy driven by macroeconomic volatility, shifting tariff policy and uncertainty in the interest rate environment. With the Federal Reserve maintaining a higher-for-longer stance on interest rates, the elevated cost of capital has constrained project financing and affected investor enthusiasm. Developers, in turn, are reassessing risk exposure—particularly as tariff uncertainty raises input costs and blurs future return expectations.
Construction activity mirrors these headwinds. Units under construction fell 33.2% year-over-year and 10.6% quarter-over-quarter, indicating widespread delays or deferrals in the development pipeline. In contrast, completed BTR units totaled 7,140, up 13.9% annually but down 2.1% from the previous quarter. The top three markets for new BTR deliveries were Phoenix (1,320 units), Orlando, Fla. (670 units) and suburban Dallas (406 units), all of which continue to exhibit elevated suburban demand trends.
Market Outlook
With new unit construction slowing, occupancy tightening in some markets and falling in others and capital flows under pressure, the BTR sector is entering a pivotal moment. While traditional multifamily continues to benefit from more favorable absorption and pricing metrics, both sectors face looming supply constraints that—if not addressed—could exacerbate affordability and availability challenges.
The next few quarters will likely be defined by how developers and investors respond to shifting fundamentals, how policy shifts (like tariffs and rates) shape project feasibility and how well the industry aligns supply with the evolving nature of renter demand.