Apartment Market Pulse Winter 2024
Navigating Challenges in 2024
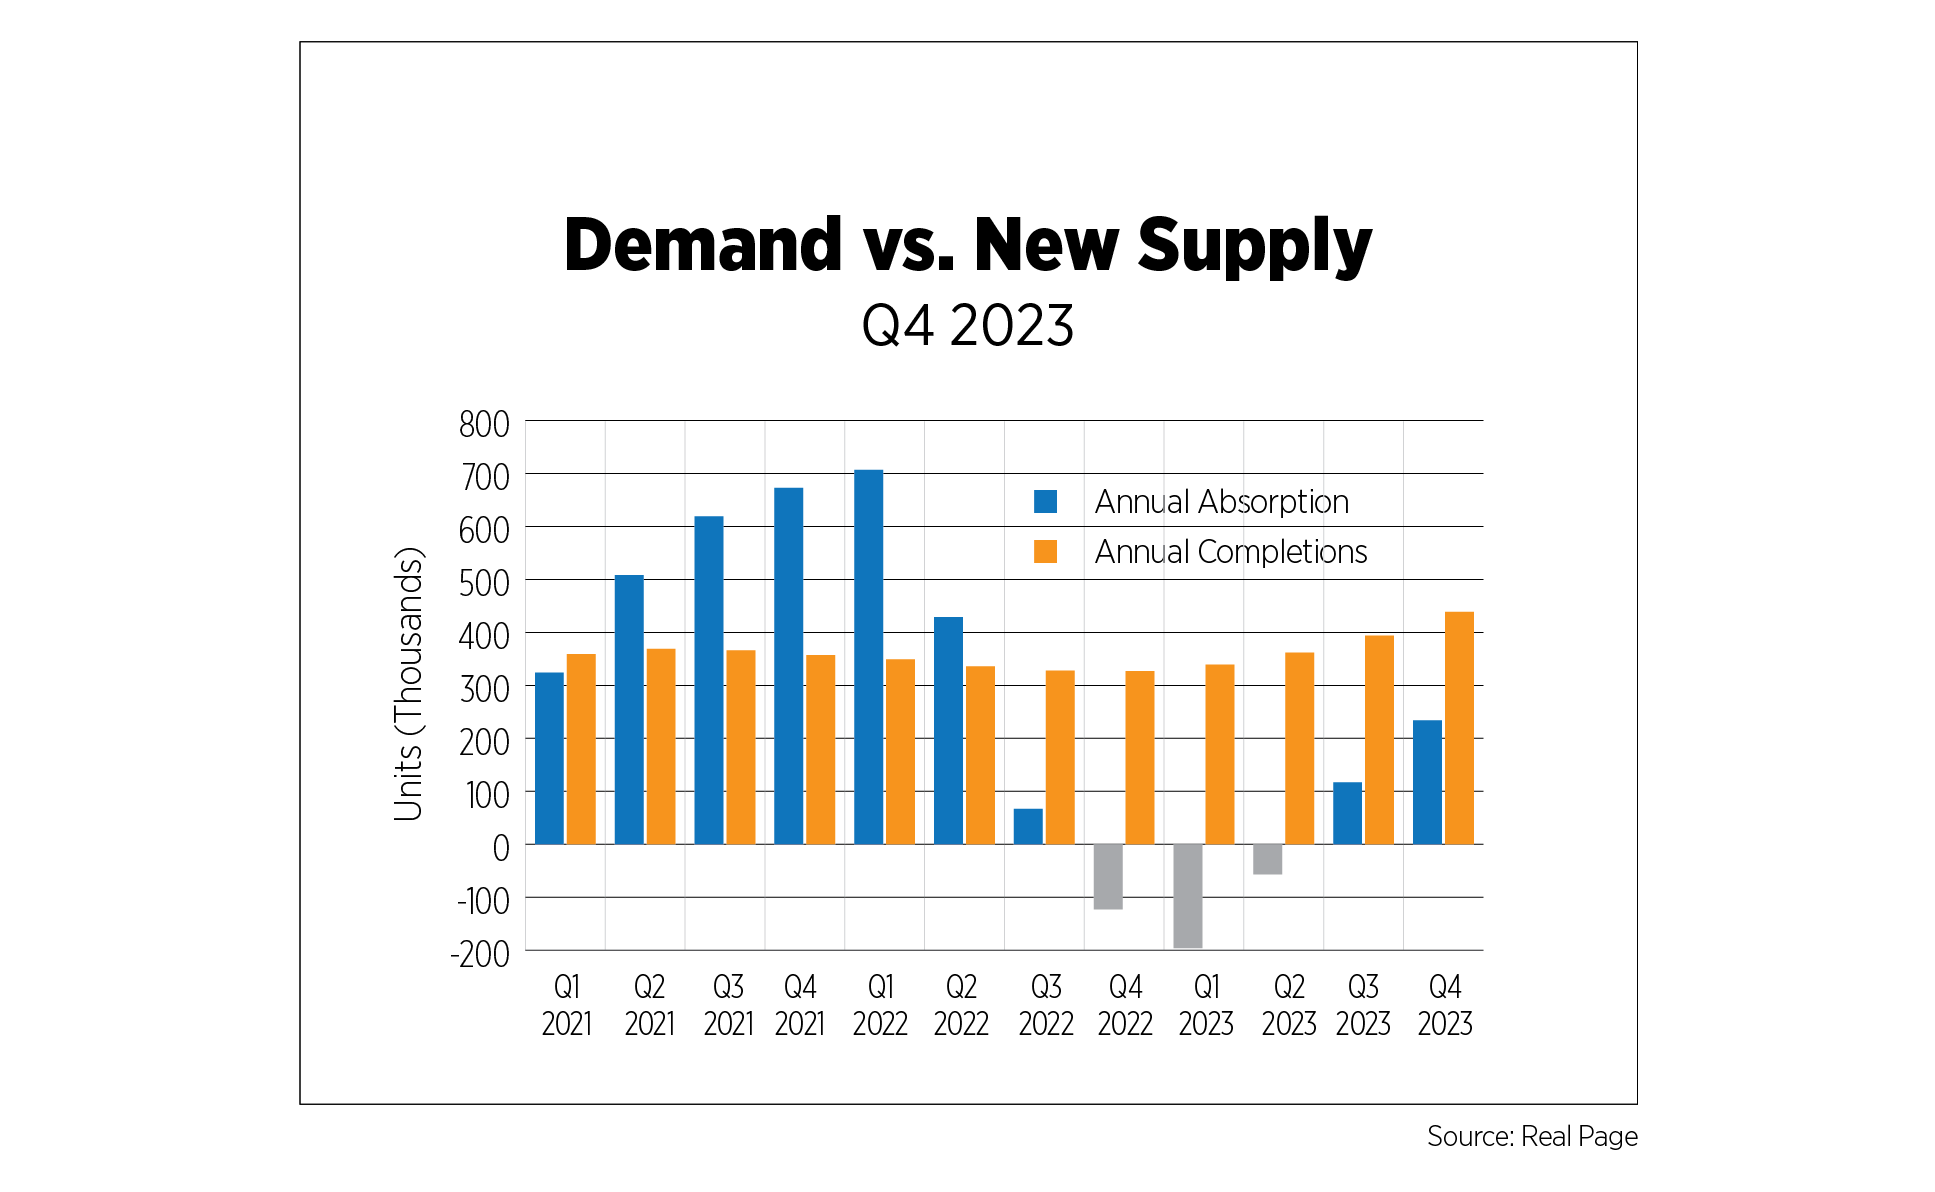
In the fourth quarter of 2023, apartment demand hit its highest point since Q2 2022. In addition, annual absorption doubled from the previous quarter, amounting to about 233,700 units, according to RealPage.
Despite the substantial increase, demand was still outpaced by supply, which surged to its highest level since 1987, representing a 36-year high. Nearly 440, 000 units were completed as of Q4 2023, which implies two significant perspectives: A wider variety of options for renters and a slowdown in the rise of rental prices.
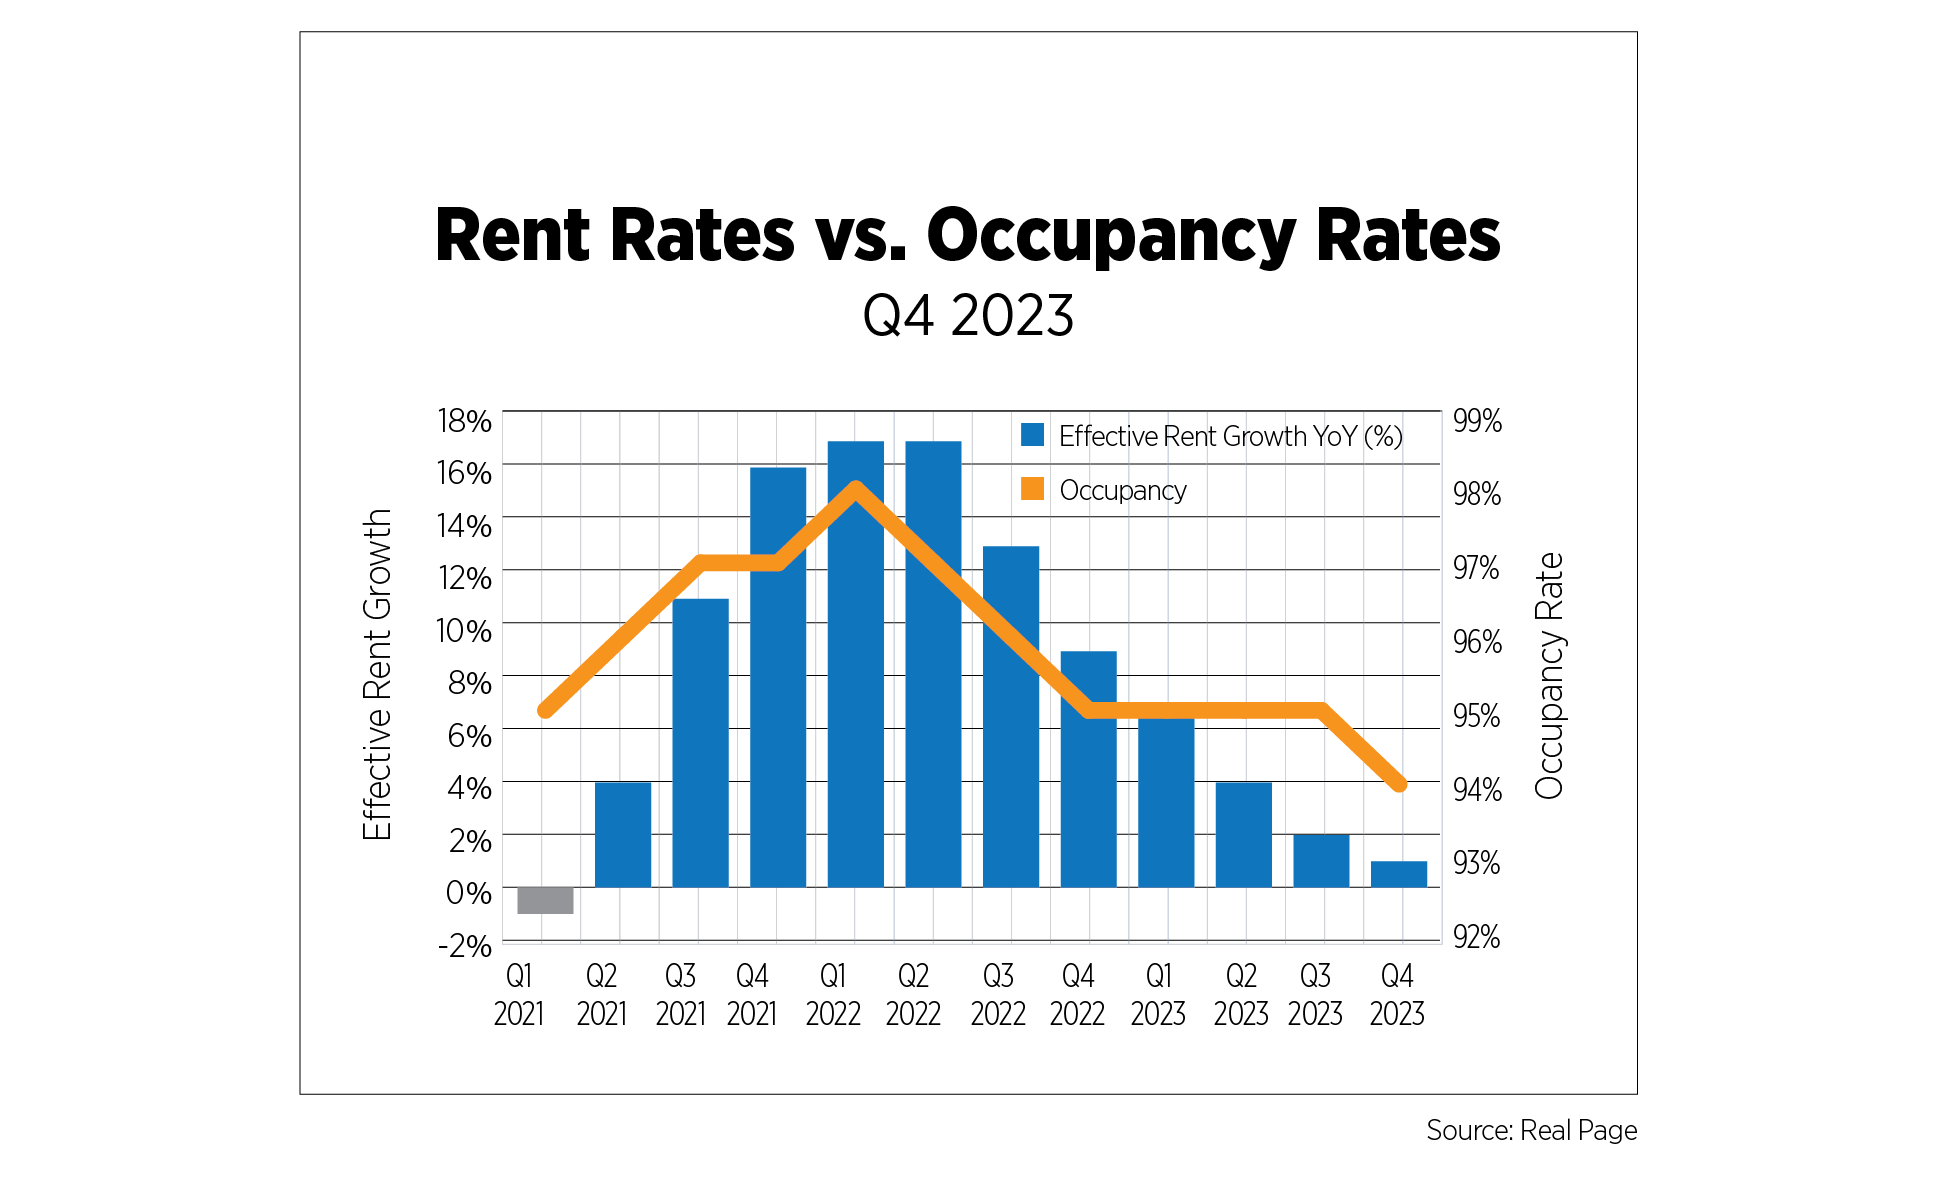
Excess supply over demand highly influences rental prices and apartment occupancy. As a result, occupancy rates declined to approximately 94%, marking decreases of 100 and 300 basis points from the preceding quarter and preceding year, respectively. Likewise, YoY overall effective rent has been gradually declining since Q2 2022. Annual rent growth flattened to about 1%, the lowest point since pandemic levels, while reaching its weakest quarter-over-quarter performance since Q4 2009 at -1.0%.
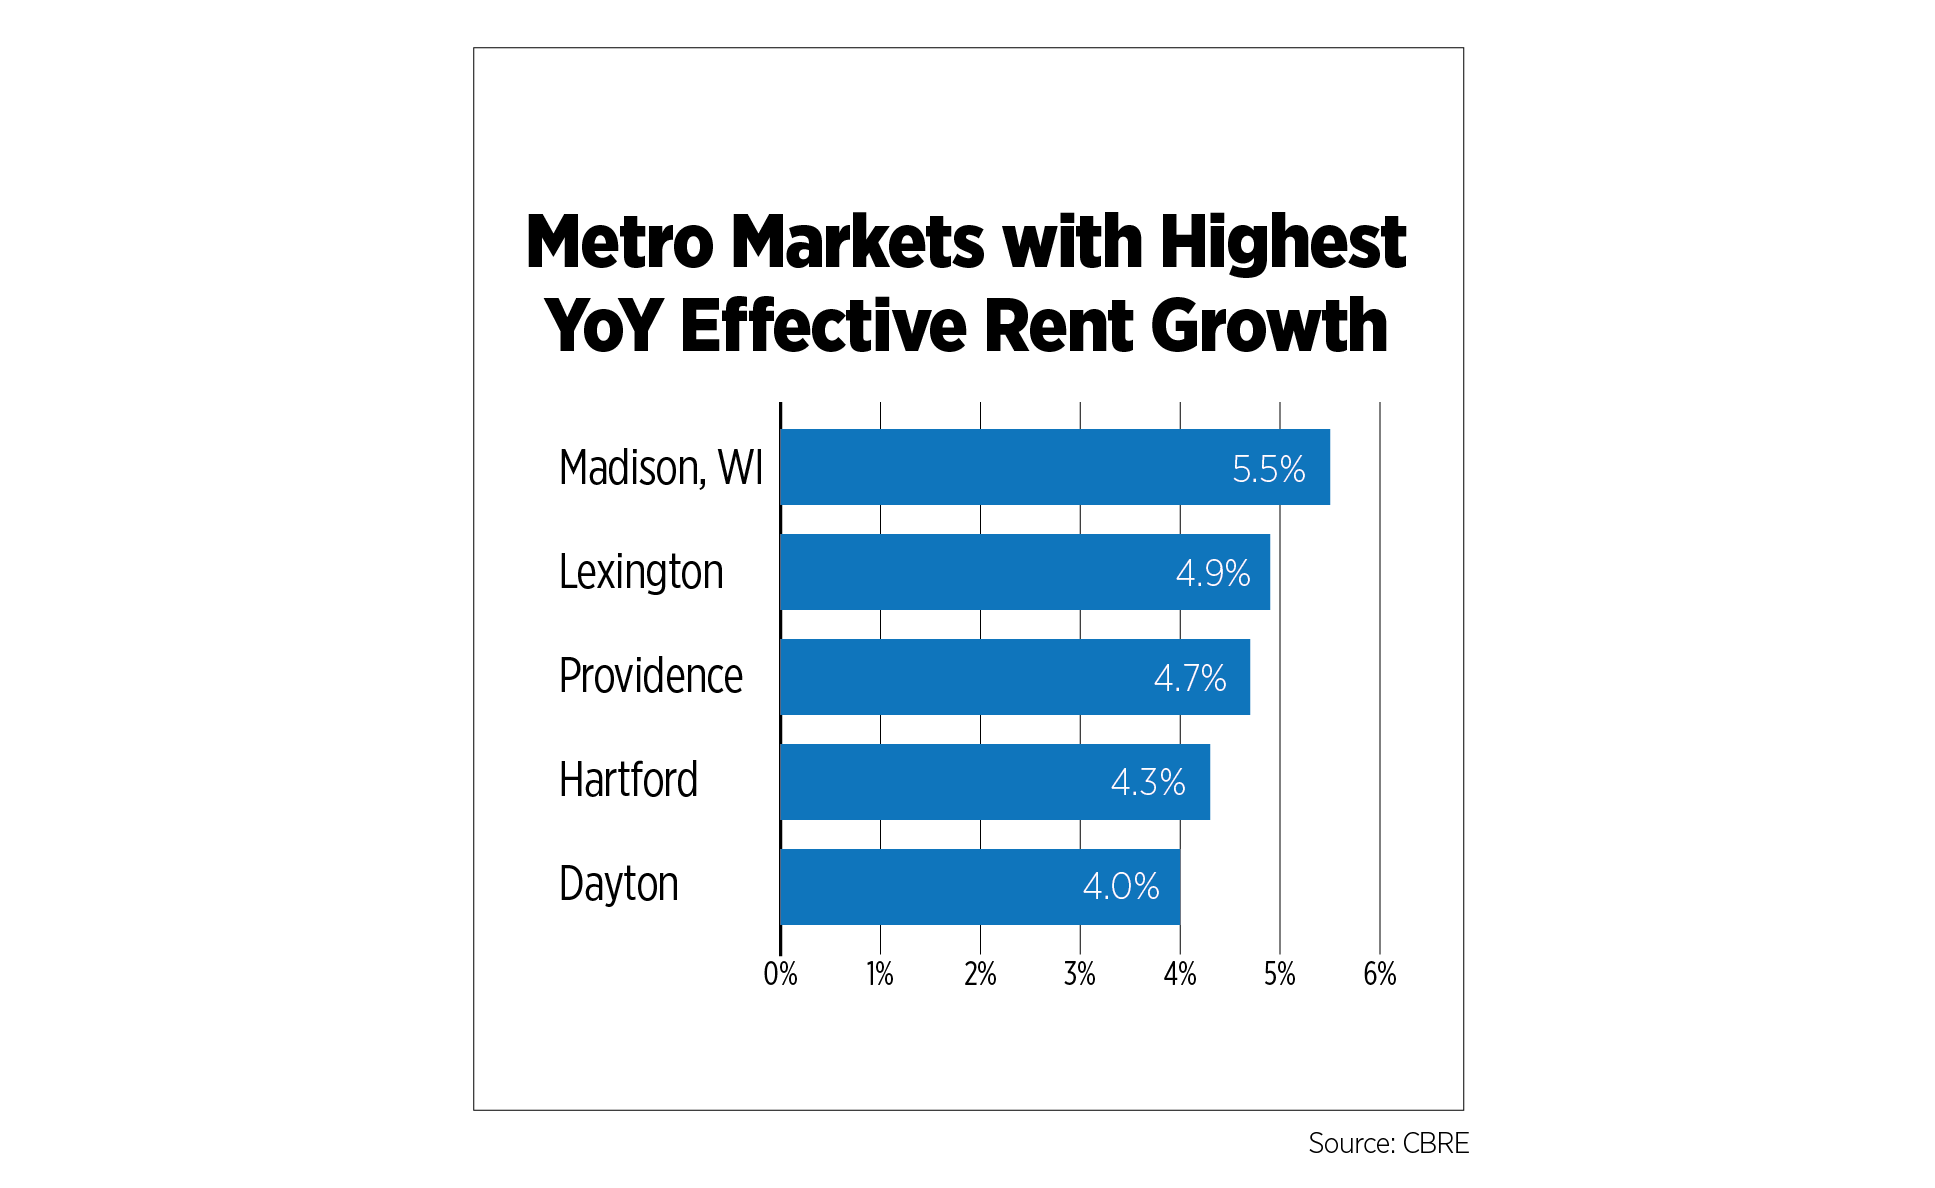
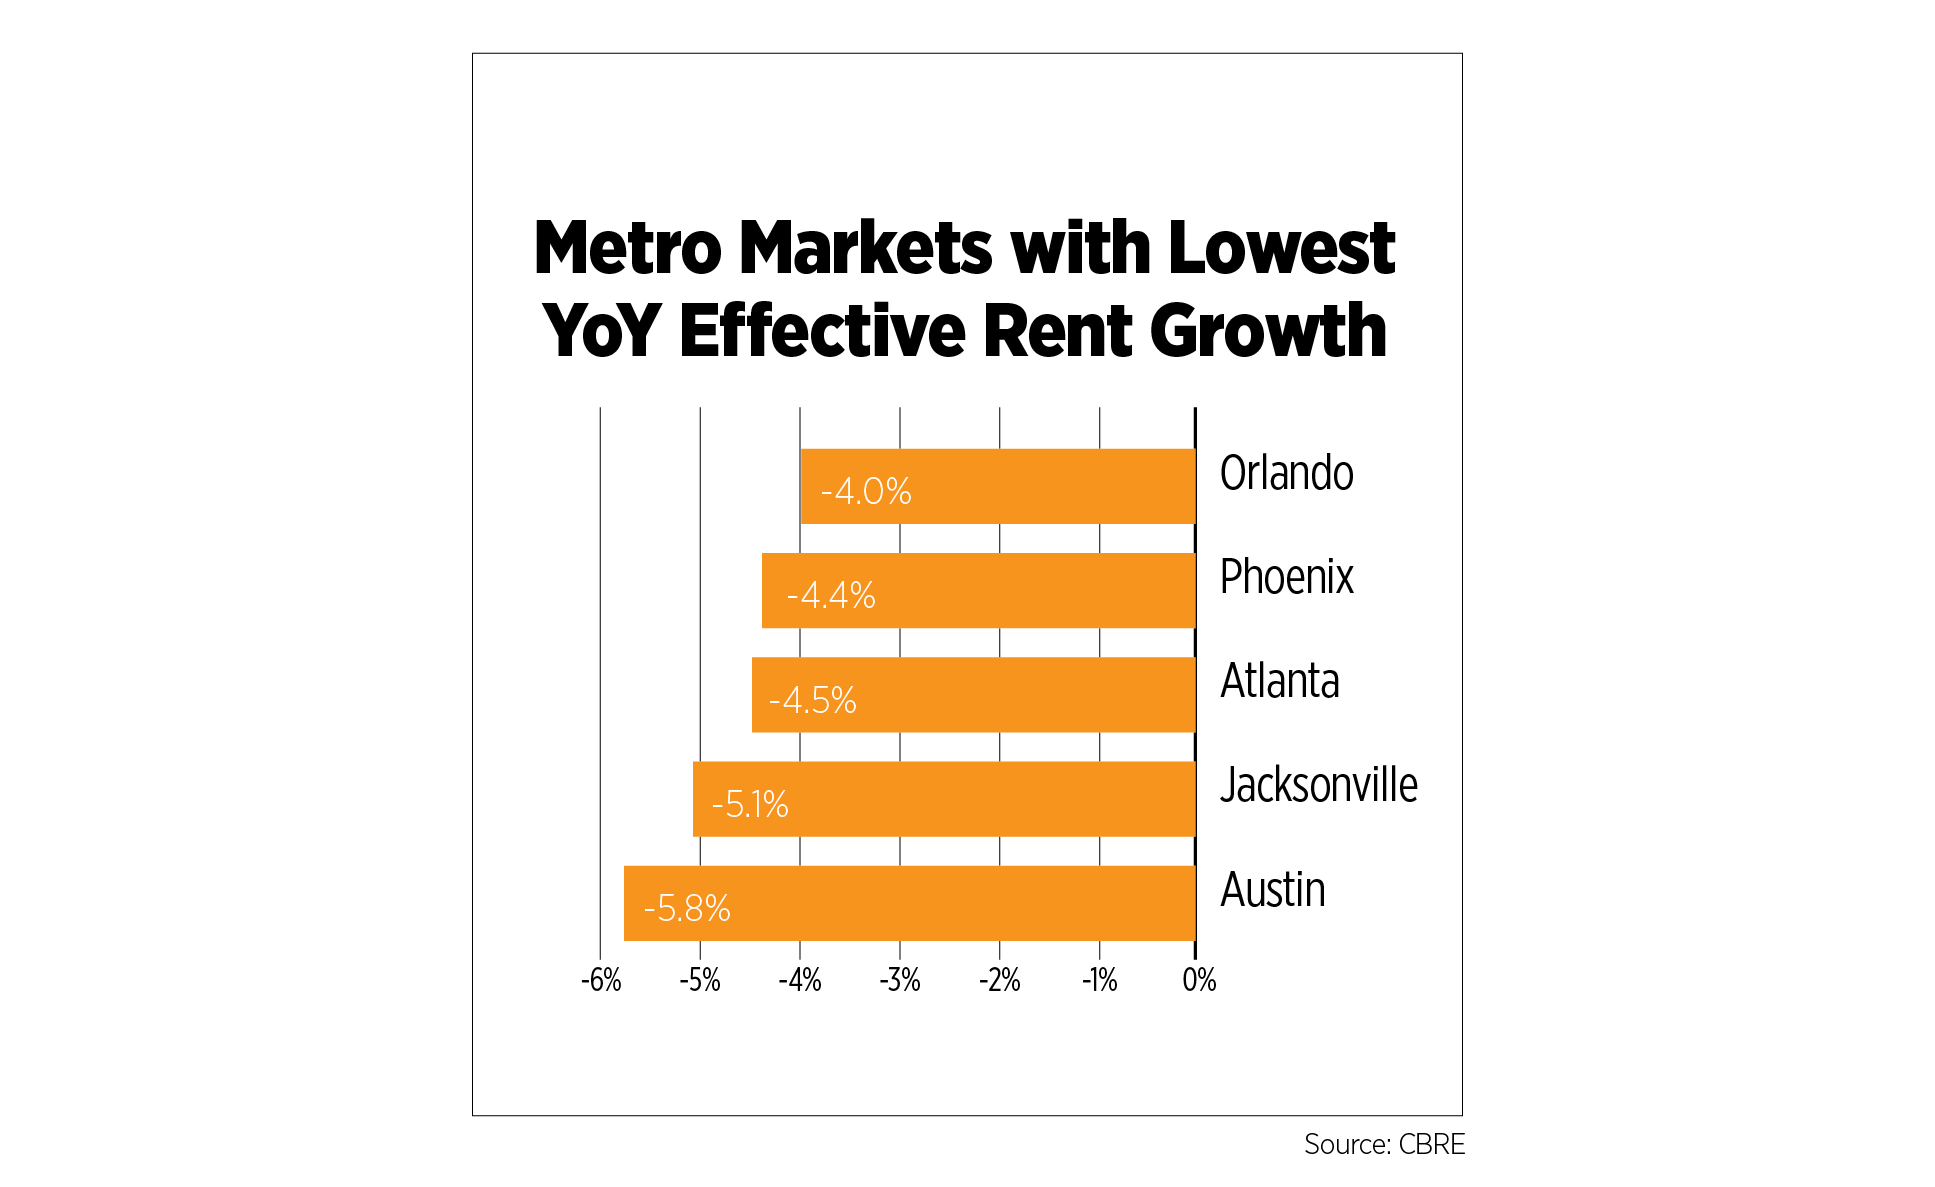
Year-over-year declines were experienced across multiple metro areas. About 42% of the metro markets tracked by CBRE had negative annual rent growth. In the fourth quarter, the Southeastern, South-Central, Mountain and Pacific regions all experienced declines in average rent growth while all markets in the Northeast and Midwest regions had increased year-over-year rent growth. Out of the 69 markets CBRE analyzed, the metro areas with the highest annual rent growth were Madison, Wis. (5.5%); Lexington, Ky. (4.9%); Providence, R.I. (4.7%); Hartford, Conn. (4.3%); and Dayton, Va. (4.0%). On the other hand, the following metro markets had the lowest year-over-year rent growth: Austin, Texas (-5.8%); Jacksonville, Fla. (-5.1%); Atlanta (-4.5%); Phoenix (-4.4%); and Orlando, Fla. (-4.0%).
A notable increase in construction completions over the quarters led to higher vacancy rates in most metropolitan markets, exceeding long-term averages and causing a deceleration in rent growth. The overall apartment vacancy rate rose by 20 basis points from the previous quarter to 5.4%, while about 71% of the markets analyzed had vacancy rates of 5% or more. Conversely, Madison had the lowest Q4 vacancy rate at 2.8%, contributing to its position as the market that experienced the highest annual rent growth. Among larger metro markets, the lowest vacancy rate was experienced in New York at 3.1%.
U.S. Capital Markets
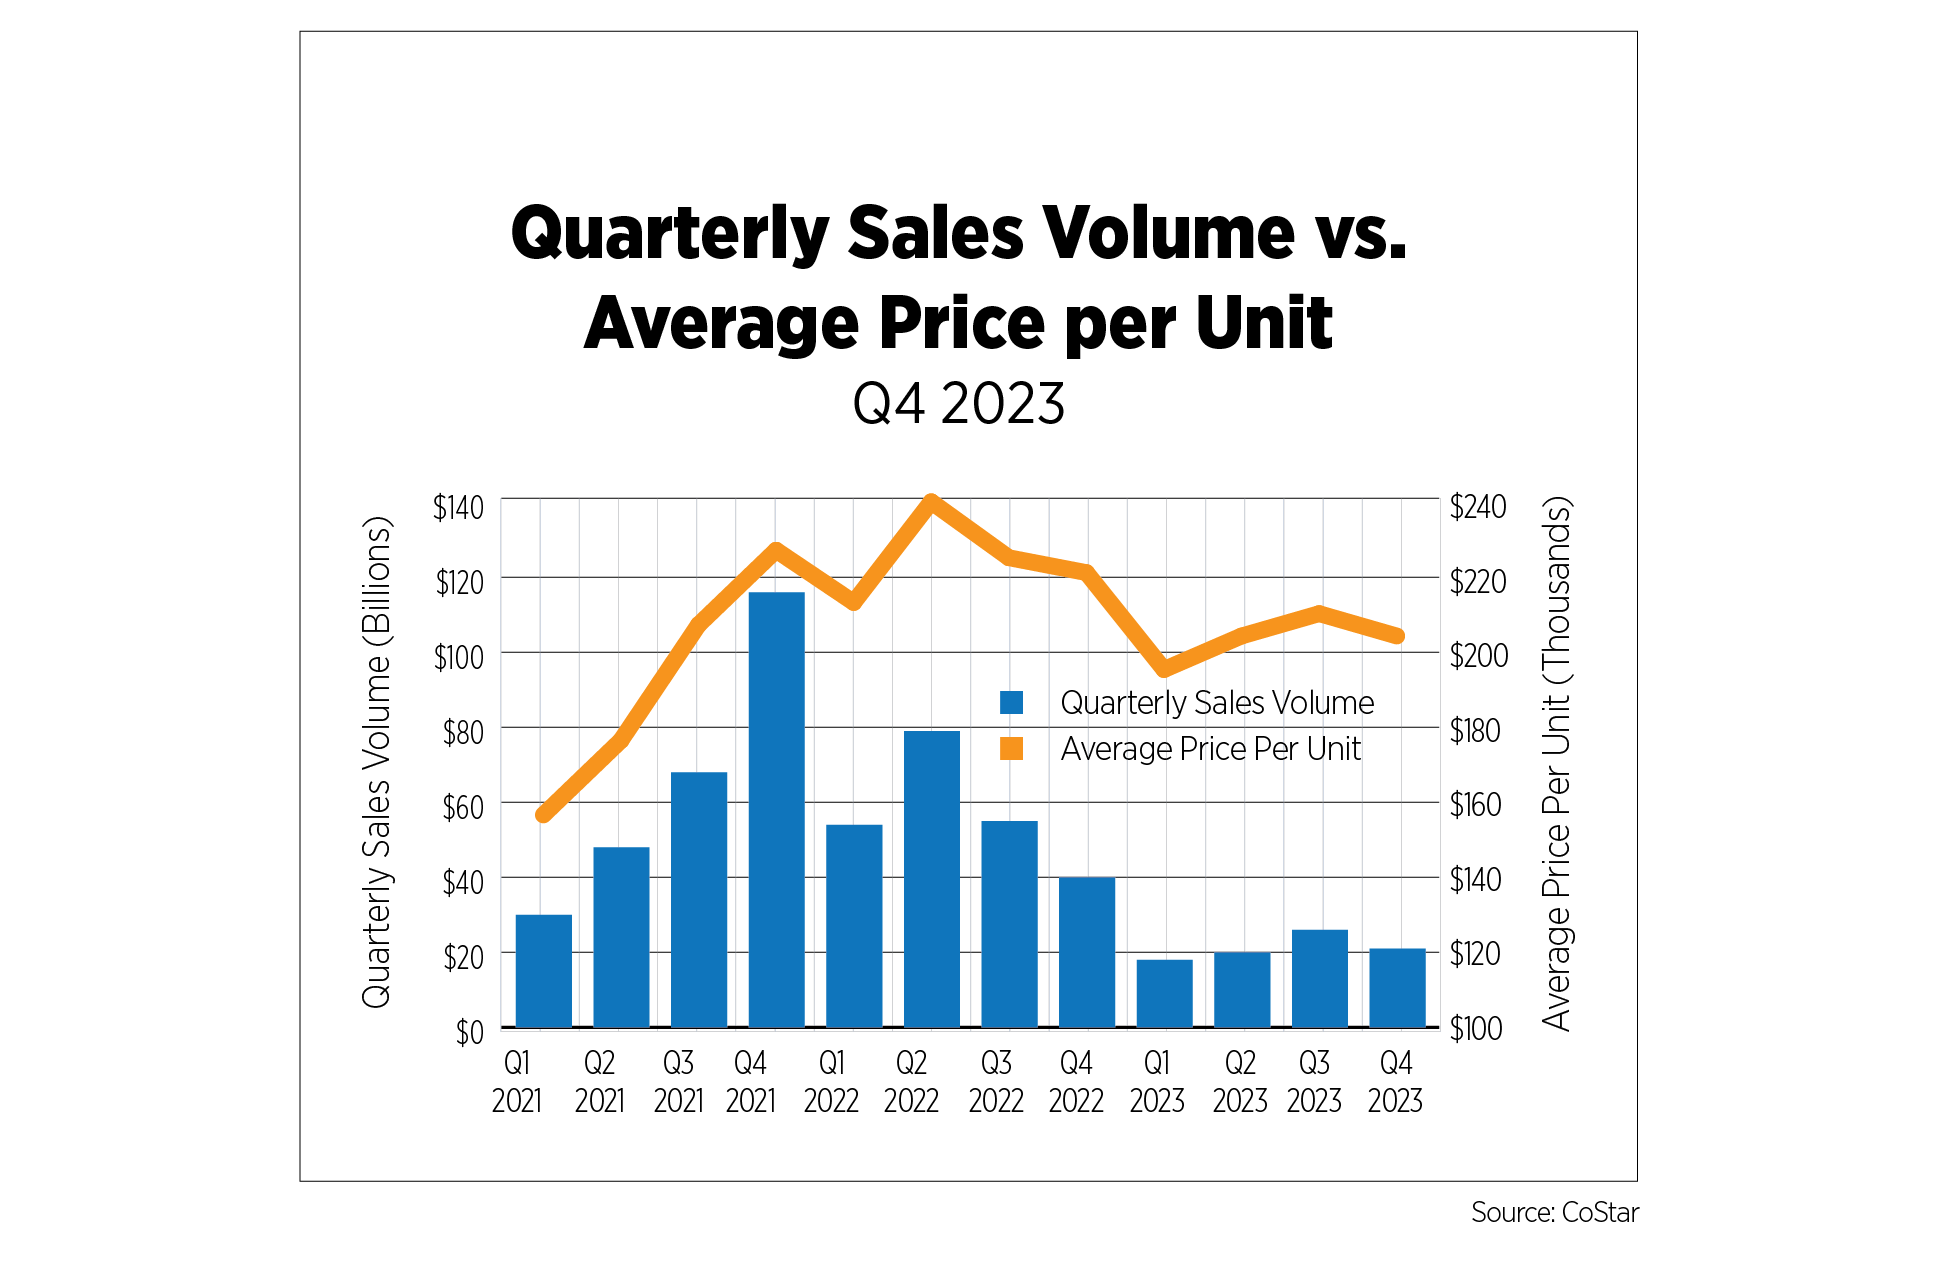
Apartment sales volume according to CoStar statistics in Q4 2023 was recorded at $20.6 billion, decreasing by 19% quarter-over-quarter and 49% year-over-year. The volume of sales remains further away from its peak in Q4 2021, at over $161 billion. As at Q4 2023, the average price per unit was at $203,540, which represents an 8% decline from the preceding year.
The median cap rate rose to 5.9%, which was about 30 basis points higher than the previous quarter and 70 basis points higher than the year before. The rising cap rate suggests weakened demand for purchasing properties as values fluctuate in a higher interest rate environment.
On a market level, as at Q4 2023, most markets experienced a year-over-year drop in sales volume. The markets with the highest YoY sales volume were Washington, D.C., and Tulsa, Okla. On the other hand, markets with the lowest YoY sales volume were Atlanta and Austin. The decline in sales volume has been widespread as high interest rates and falling values keep both buyers and sellers on the sidelines.
U.S. Build-to-Rent Market
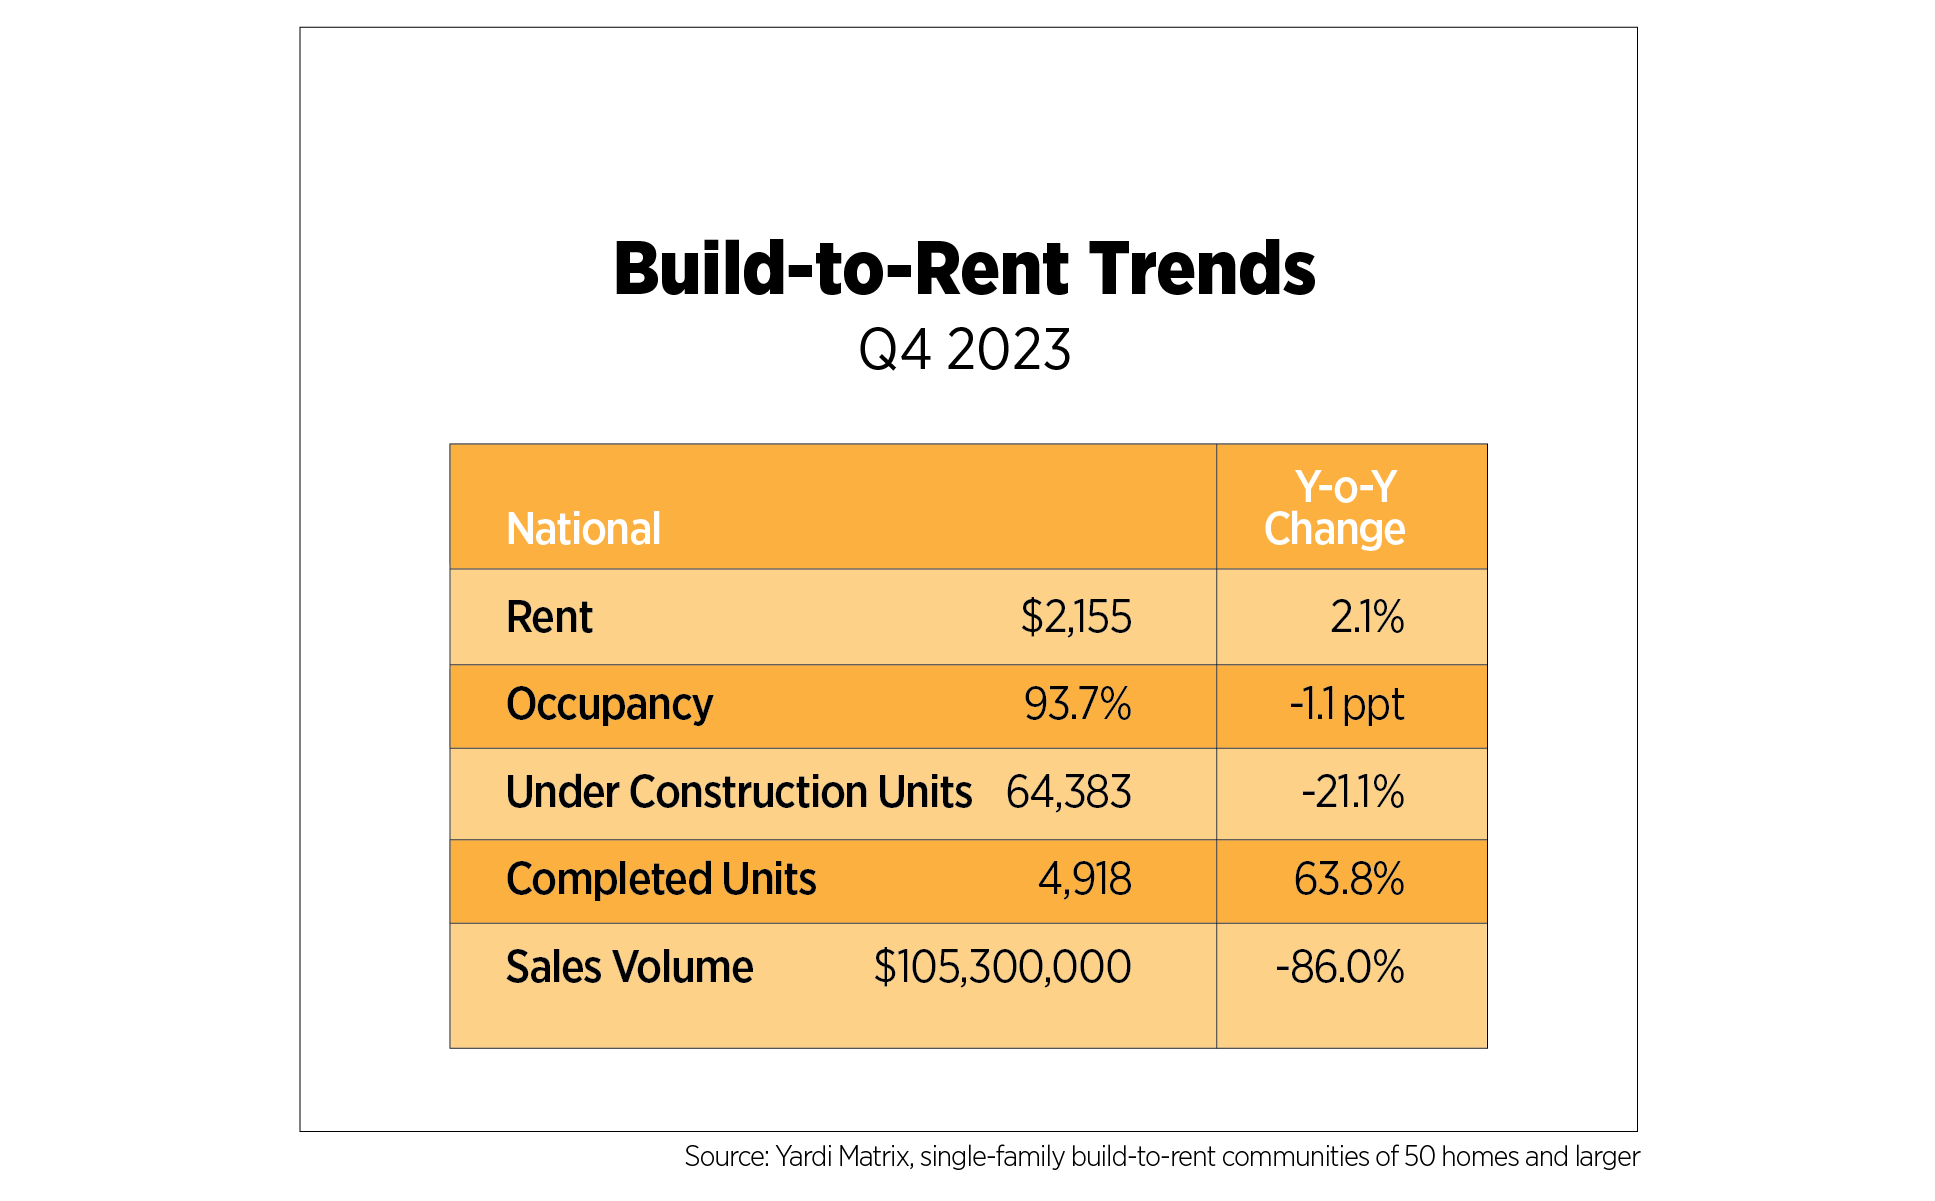
National effective year-over-year rent growth as at Q4 2023 was recorded at 2%. Data derived from Yardi’s single-family build-to-rent (BTR) trend report depicted a 0.5% quarter-over-quarter rise in effective rent on a national level, amounting to $2,155.
The number of housing units under construction dropped to its lowest point since the post-pandemic period, totaling about 64,000 units. Approximately 4,900 units under construction were completed in the last quarter of 2023, while the occupancy rate declined 1.1 percentage points to its lowest point since 2010 at 93.7%. The markets with the highest completed units were North Dallas, Texas (1,045); Phoenix (906); Atlanta (515); Cleveland (250); and Kansas City, Mo. (221).
Transaction volume fell to its lowest point since the pandemic at $105 million, which is about an 86% year-over-year decline and an 81% quarter-over-quarter decline. This significant dwindle in sales volume is a result of surging interest rates and a wide gap in buyer and seller price expectations.
U.S. Economy
The U.S. economy ended 2023 on solid footing and the momentum has continued into 2024 thus far. While Q4 GDP was not as strong as the previous quarter, it was well above expectations. Consumers once again held up the economy with real spending, which takes inflation into account, increasing by 3.2%.
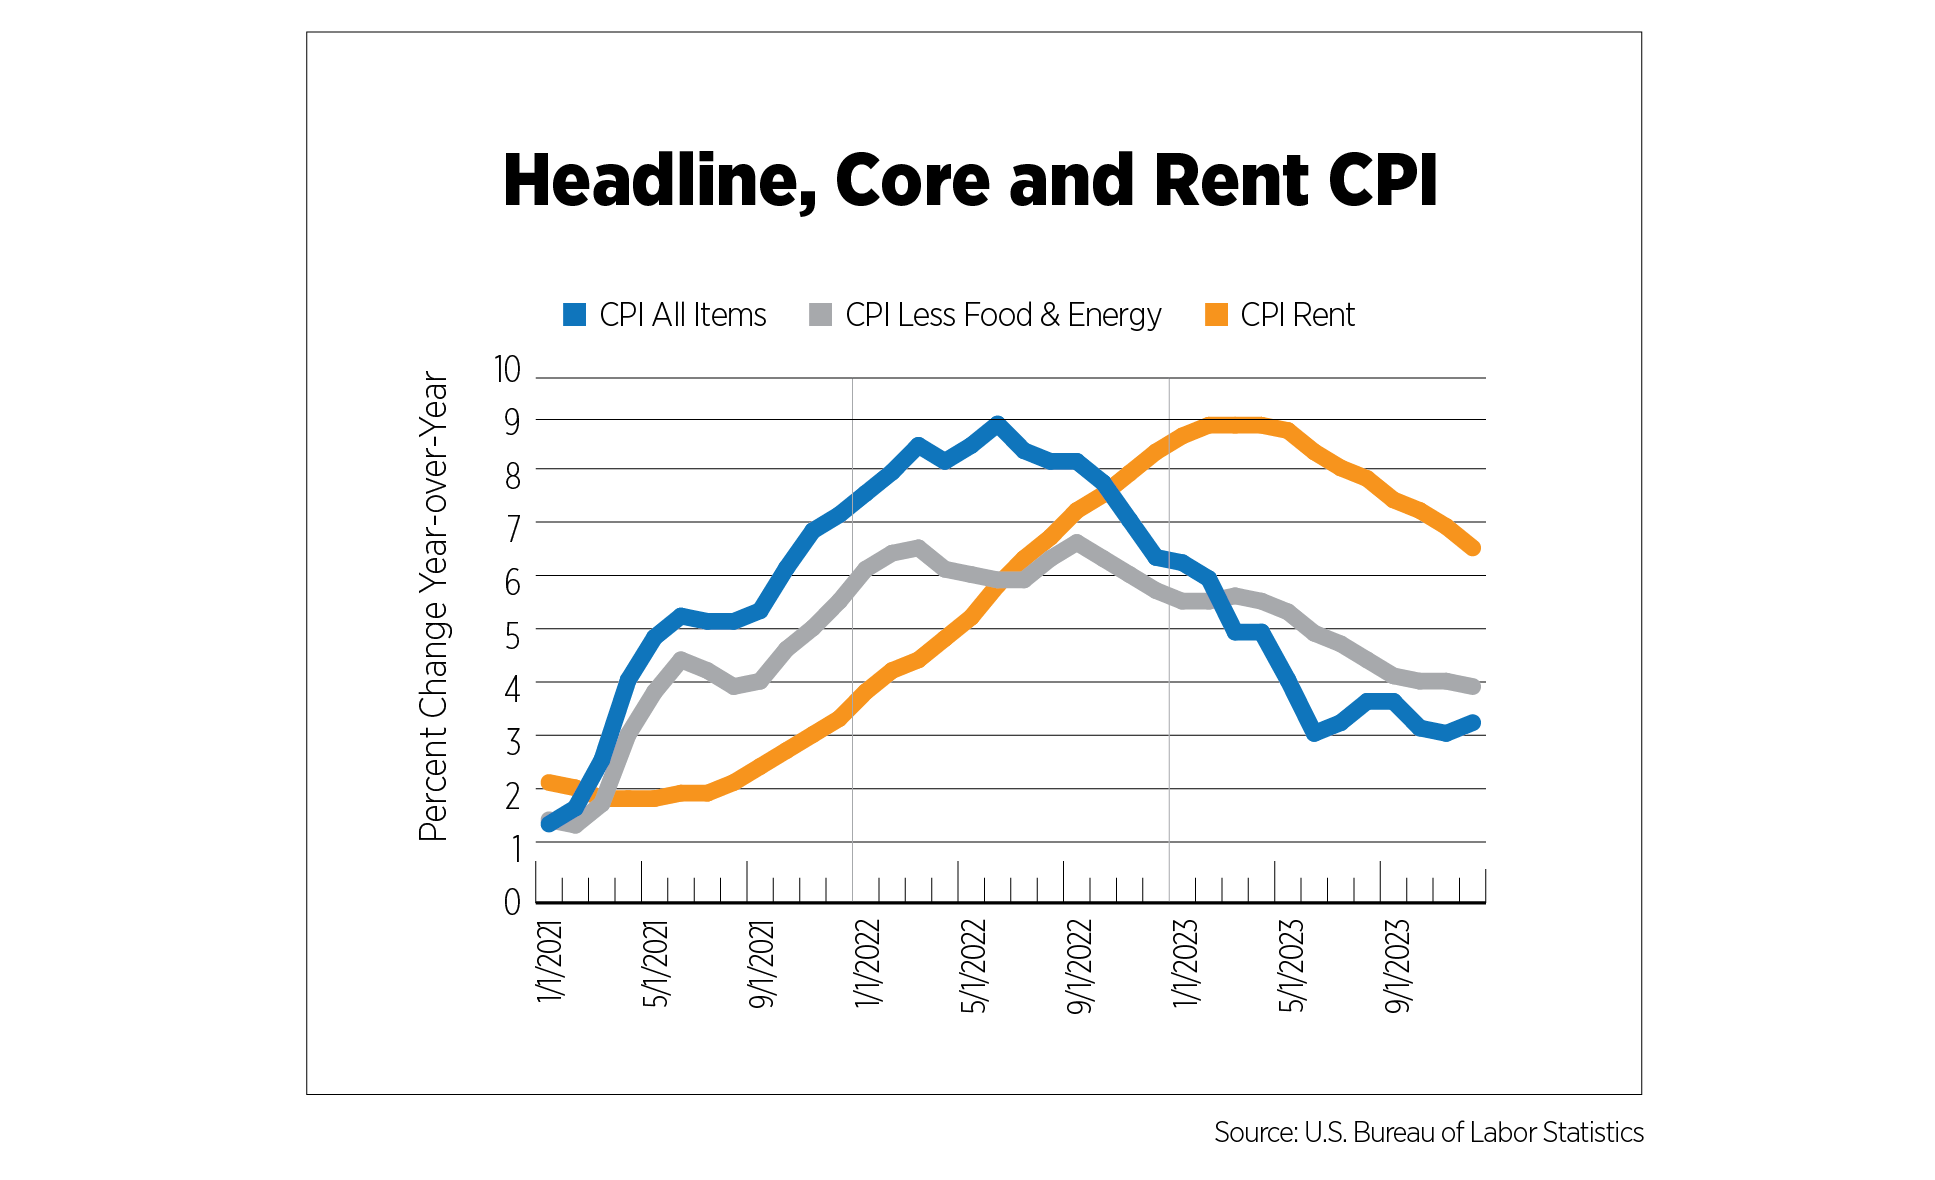
Inflation has had its ups and downs as it inches closer to the Fed’s 2% target, as was expected. In January, headline CPI came in at 3.1% year-over-year and has been in the 3.1%-3.3% range for the past 4 months. Core CPI, excluding food and energy, continued to trend downward, and increased 3.9%. The angst in the financial markets after the January CPI release was caused by the month on month increase for core CPI, 0.4%, its highest level since May 2023.
Shelter cost inflation has been steadily decelerating on a year-over-year basis, but the two measures, owners’ equivalent rent and rent of primary residence, are showing signs of diverging. In January, owners’ equivalent rent increased 0.6% month-over-month, the highest rate in nine months. Rent of primary residence, on the other hand, was up 0.3%, its lowest rate of increase since July 2021. The rate of annual deceleration has also improved, and if it stays at 0.4%, rent CPI would hit its pre-pandemic norm of 3.7% by this summer.
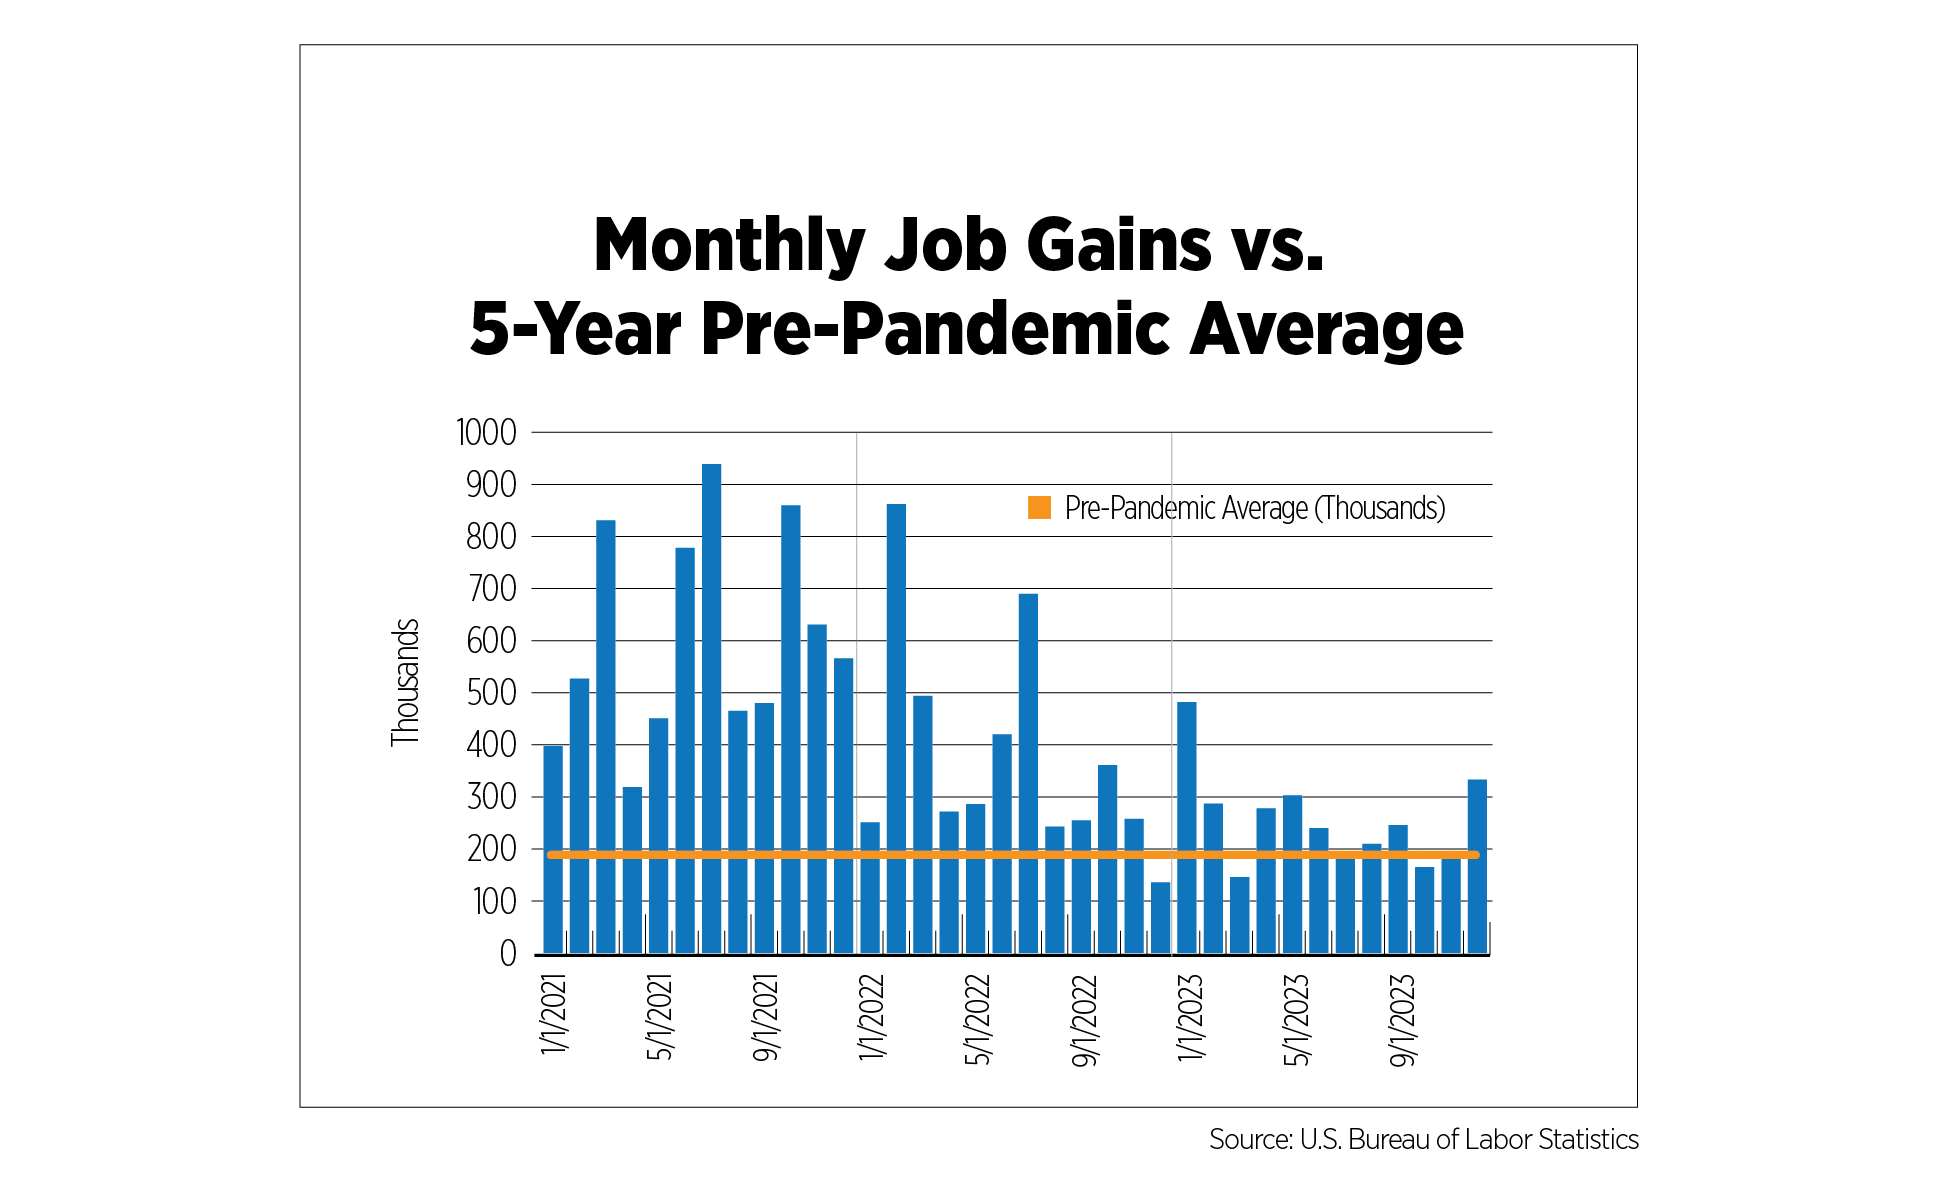
In January, 353,000 jobs were added, almost double the consensus forecast of 180,000. Additionally, November and December’s payroll numbers were revised upward by a combined 126,000. These figures do not paint a picture of a cooling labor market, but other employment indicators are signaling shifts. Although job openings ticked up slightly in November and December, there are 3 million fewer jobs available than the peak in March 2022. Quit levels have also been on the decline and at 3.4 million, are now back to pre-2020 levels, with fewer employees confident that they can easily land another position. Layoff announcements are trending upward, according to the outplacement firm, Challenger, Gray and Christmas. Over 720,000 layoffs were announced in 2023, more than 2022 and 2021 combined, and well above pre-pandemic averages. Announcements in January declined on a year-over-year basis but employers’ plans to hire were at the lowest point on record.
Outlook
Even though consumer sentiment surged during the past two months, businesses remain pessimistic according to the National Federation of Independent Business’s Small Business Optimism Survey. The index has had readings below long-term averages for the past 25 months. High interest rates, the wars in Ukraine and Gaza, heightened tensions with China and Russia, yet another pending government shutdown and the 2024 elections have many business owners on edge. Economic uncertainty prevails in 2024.
Businesses and investors hoping for interest rate cuts to arrive during the first half of 2024 have been soured by hotter-than-expected inflation, stellar job growth and comments from Fed officials themselves. The CME Fed Watch Tool has now pushed the highest probability for a Fed rate cut to June (from March just a few months ago) as have many forecasters and analysts. However, probabilities for recession have been widely downgraded.
The most recent survey of Senior Loan Officers, published by the Fed’s Board of Governors, may indicate some loosening in lending standards for loans secured by multifamily housing properties, but with just one quarter of data moving in the right direction, it is far too early to tell. Demand for multifamily loans, as reported by the same survey, remains severely depressed.
The Mortgage Bankers Association reports that approximately 22% of multifamily loans worth $470 billion are coming due in 2024 and 2025. Many of those loans will be extended or restructured, and while we can expect to see some distress in some pockets of the industry, it will not rise to the levels of what is likely to continue to unfold in the office sector.
There is no doubt that 2024 will be a challenging year, but demand-side fundamentals are boding well for rental housing. Strong job growth and wage growth that is outpacing inflation will push some of the 6.8 million 25-34- year-olds living with their parents to form their own households. With construction already slowing, the supply side challenges will likely play out as a relatively short-lived problem. Still, rent declines and concessions coupled with highly elevated operating and financing expenses will squeeze net operating income for many rental housing providers this year.